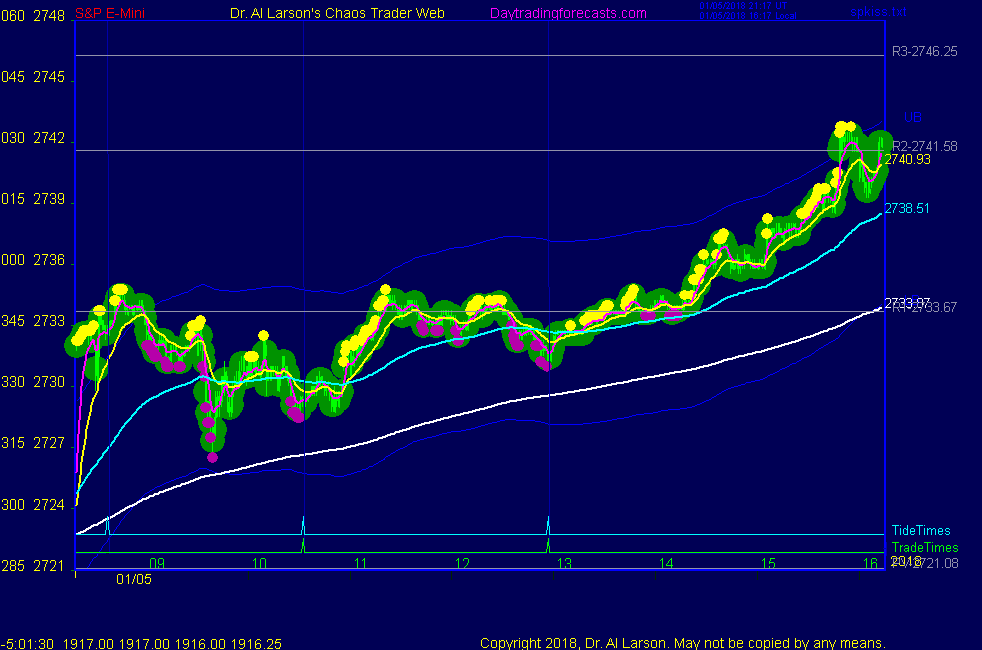


The chart on the AUX page is taken from the SPKiss page
on http://daytradingforecasts.com
It shows the dramatic change in the market between the last day of 2017
and the first week of 2018.
The diagonal lines are Moon electric field flux lines at various harmonic aspects.
At point A, the rally on 12/29 was stopped by the down sloping flux line. The market
sold off all day, ending is a dramatic late drop.
Things change over long weekends. The significant thing that changed here was the Full Super Moon
at 2:24 UT on January second. As the day advanced, the rising Moon Flux on line C caught prices.
Prices began moving up, being carried along the next higher Moon flux line D. On the 2nd
this move caused a crossover on the 440 minute/2400 minute EXMAs.
Since then the market has rallied in what could be a seven move Chaos Clamshell.
Looking ahead, Monday the 8th shows down flux. So anyone long here should consider
Taking profits on some of their position.
The electric field is real, even if we can't see it. At Full Moon, the Moon reflects
negative ions back into the atmosphere, causing us humans to feel giddy. In this case,
that showed up in the market this week.
9:00 Eastern-System: No comments