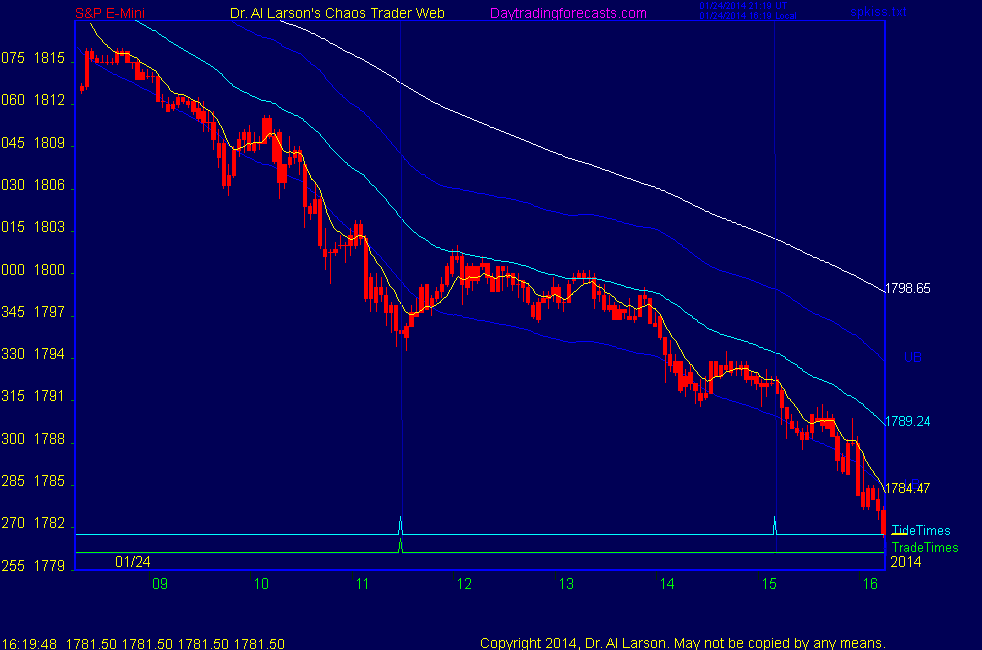


1:00 I'm done. Thanks foe coming. See you next week. Take a course.
12:58 I had a power outage and had to get all my computers back on the air this morning-distracted me from
any early trading, so I waited until the one trade time and mad a bit ; so I'm happy
12:55 we are now out of the trade window, so I will not make another trade; from here we are probably flat to weak up
12:42 I aborted because we did not get a 20/110 buy, telling me my early entry was in trouble
12:39 aborted on stall for +1.5; may rebuy
12:34 stop to 97, break even
12:31 stop to 1796 risk 1
12:28 I have placed a Face of God chart in the Certified Chaos Trader's Room. That room is open
to graduates of my 4 main courses. See http://moneytide.com -> Courses for details.
eMylar Fractal of Pi overlays help you be patient, since they show you future potential moves.
The best bargain in my courses is to take the Cash In On Chaos and Fractal of Pi courses and
learn to use the FOP overlay. Then take Chaos Trading Made Easy, and finish with Face Of God.
12:16 up to the 110 EXMA -watching for a 20/110 buy crossing - danger signal if don't get it
12:13 stop now to 1795 - risk 2
12:09 support came on R5 -good
12:05 not moving stop yet-first pullback since low-need low to hold
11:57 looking good
11:47 on the SRT chart on AUX page have a 15/20 EXMA early buy signal
11:44 I figured R5 and R1 would be attractors, so bought below them
11:40 this is a technique I'm still working on, and not the normal 20/110 EXMA method
11:36 call me crazy - bought 1797 stop 1794 off the SRT chart
11:32 watching for some lift
11:22 the EXMA's need to turn up
11:19 coming to exact Tide time trading at R5
11:09 cancelled sell stop
11:03 putting a sell stop at 1799 ; protection for a buy entry
11:01 still tracking red -Tide
10:58 1800 is a major price level on both the wheel of 72 and wheel of 360
10:54 touched R1
10:42 next lower R5 level is 1798.25 and R1 1799.5
10:36 dropped to the R6R7R11 triple SR level
10:33 still just watching and analysing
10:31 but not there yet
10:27 nearly an hour before trade time, but looking like a low coming in
10:22 and back up to R1
10:19 still fishing for a bottom-R9 not hit, back up to R5
10:17 down below the R5 -still following red -Tide
10:11 the 3 minute candles on the chart are colored red or white by the crossings of the 15 and 20 minute EXMA's
these are the "quick entry" EXMA's discussed in the trading the Moon Tides material
10:08 for example, the early decline reversed near R5/R1; it touched R2/R3 but not R9; a sell stop could go at R9
10:03 I use this chart to help me set entries, stops, and targets
9:58 the timelines seem to activate the price lines, making them attractors-note the effect at 02:00,05:00, and 09:45
9:54 the horizontal lines are where these cycles may find support or resistance. The T5 cycle goes with the R5 SR, T1 goes with R1, etc.
9:52 the vertical timelines are cycle turns in multiday cycles T1-T12; today T5 and T1
9:48 so far this 24 hour chart shows prices following the red -Tide; the cyan line near price is a MoonTide cycle tracker
9:44 on the AUX page I am showing a research chart called MoonTide SRT for SupportResistanceTime
9:41 the S&P delined sharply yesterday, rallied, then declined sharply overnight. Now it looks
like it is probing for a bottom
9:33 one trade today at 11:29
9:00 Good Morning. Welcome to the Chaos Clinic. This site has a lot of charts,
so you may find it useful to have several of them available within your
browser. If you have a tabbed browser, you can open separate charts
in separate tabs by right clicking on any link, and selecting "open in new tab"
from the menu. The main list of site pages is at
http://daytradingforecasts.com/chartlistsec.asp
Recommended pages to watch are SPKISS, MTRainbow, and Chat.
For astro stuff, add SPSunMoonMer, Wheel, and Chaos Clinic.
Chaos clinic comments appear at the bottom of the SPKISS, MTRainbow,
and ChaosClinic pages. Comments in the chat room are announced by a
"duck call" noise. This noise also occurs when the sofware detects a
resonant hex pattern on the Wheel page. Trading tutorials
are on the right side of the ListOfCharts page. One should
read Trading the MoonTide Tutorial and Keep it Simple as a minimum.
9:00 Eastern-System: No comments