**************************************************************************************
United Airline's New Normal
Chaos Clinic for 1/27/2023
***************************************************************************************
We often hear that "The COVID pandemic is over, and things are back to normal."
This is not universally true, especially in industries such as air travel.
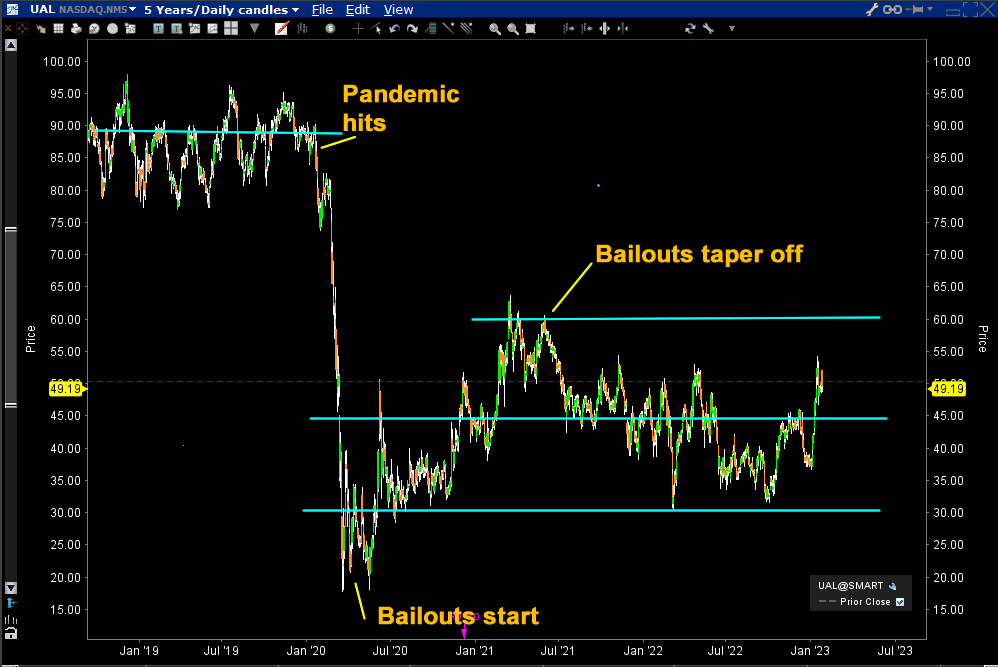
This five year daily chart of United Airlines is a good example.
In the year before the pandemic, UAL oscillated about an average price of 90.
When the pandemic hit prices plunged to a low of 18. Then they rallied
over the next 14 months to a recovery high near 60, helped by huge government
bailout support.
As that support tapered off and operations resume, over the next two years
prices dropped to near 30, oscillating about 45. This 45 is a reasonable
estimate of the "New Normal."
This is just one example of the damage done by the pandemic. While we have learned
how to cope with it, it has had a major impact on the world economy, and many of the
longer term effects are yet to be felt.
For more on my work and to subscribe to Tomorrow's Market Email Hotline and access to daytradingforecasts.com see
Moneytide.com
Software to plot electric field flux lines in NinjaTrader is available at
energyfieldtrading.com

1/27/2023 1:46:52 PM MT Al****:: stopped out- done-thanks for coming - see you next week-take some courses
1/27/2023 1:41:16 PM MT Al****:: lowered my sell limit to 4118 R3
1/27/2023 1:34:45 PM MT Al****:: stop 4095
1/27/2023 1:23:30 PM MT Al****:: got some selling at R2, but I'm holding
1/27/2023 1:10:08 PM MT Al****:: stop 4093
1/27/2023 1:08:12 PM MT Al****:: move just accelerated
1/27/2023 1:07:34 PM MT Al****:: stop 4191
1/27/2023 12:53:16 PM MT Al****:: stop to 4090; locking 18 points
1/27/2023 12:51:09 PM MT Al****:: big up days often are up 60 or 75 points, so could make it
1/27/2023 12:49:21 PM MT Al****:: put a sell limit up there just for fun
1/27/2023 12:43:02 PM MT Al****:: the pivot prices are listed on the SP1Day page
R4 of 4137 may seem crazy but it is the next vibration level on Secret->esnat360
1/27/2023 12:32:09 PM MT Al****:: stop 4088
1/27/2023 12:17:01 PM MT Al****:: stop to 4585.75
1/27/2023 12:15:09 PM MT Al****:: am carrying through second trade time - a rqally here would be on the green +tide
1/27/2023 12:01:51 PM MT Al****:: an indicator from the Chaos Trading Made Easy course told me this breakout was coming
1/27/2023 12:00:32 PM MT Al****:: stop to 4083.25
1/27/2023 11:50:35 AM MT Al****:: coming to the second Tide trade time. I'll just carry through
1/27/2023 11:48:18 AM MT Al****:: this looks to be a move 4 of 7 in a Chaos Clamshell, so trying to hold
1/27/2023 11:47:10 AM MT Al****:: holding up but not much energy-stop to 4082.25
1/27/2023 11:32:37 AM MT Al****:: added some juice, just like yesterday
1/27/2023 11:24:57 AM MT Al****:: now about to rotate past Venus
1/27/2023 11:13:37 AM MT Al****:: getting a dip as the exchange rotates past Saturn
1/27/2023 10:50:50 AM MT Al****:: stop to 4080.25
1/27/2023 10:14:07 AM MT Al****:: I have posted a chart in the CCTRoom
1/27/2023 10:06:32 AM MT Al****:: stop to 4075.25
1/27/2023 9:55:35 AM MT Al****:: moving stop to 4074.25, at the 220 minute EXMA
1/27/2023 9:40:47 AM MT Al****:: my stop is now at 4072, break even
1/27/2023 9:38:12 AM MT Al****:: I also was watching secret->esnat72 - white level was overnight resistance, then became support
1/27/2023 9:36:34 AM MT Al****:: yesterday's market had a similar early high, decline, and a low near 11:00
1/27/2023 9:34:32 AM MT Al****:: based on higher low and Moon time line
1/27/2023 9:33:27 AM MT Al****:: I did rebuy 4071.86
1/27/2023 9:31:39 AM MT Al****:: chart 3 on SPKISS shows 440 minute EXMA still up
1/27/2023 9:19:20 AM MT Al****:: high was on Mercury timeline, now low on Moon +T270 timeline
1/27/2023 8:47:36 AM MT Al****:: out for +3
1/27/2023 8:46:42 AM MT Al****:: I was lucky enough to catch the first rally
it was on the green +Tide
on the Chaos clinic chart the red -Tide and the green
swan show an afternoon rally - trying to hold for that
1/27/2023 8:16:40 AM MT Al****:: lows were just above the pivot-now at R1-proibaly see R2 later today
1/27/2023 8:15:35 AM MT Al****:: notice on the Secret->esnat72 chart the vertical white line here-it marks a potential high energy time - was today
1/27/2023 8:07:42 AM MT Al****:: using chart 4 on SPKISS I bought 4067 stop now 4070
1/27/2023 8:02:59 AM MT Al****:: chart 7 on SPKISS shows the quarter Moon cycle up, with dip to cyan midpoint
1/27/2023 7:48:31 AM MT Al****:: just broke yesterday's high
1/27/2023 7:46:06 AM MT Al****:: chart 3 on SPKISS page is showing up market today
1/27/2023 6:37:31 AM MT Al****:: Good Morning visitors. Welcome to the Chaos Clinic.
The written Chaos Clinic is on the AUX page.
This site has a lot of charts,
so you may find it useful to have several of them available within your
browser. If you have a tabbed browser, you can open separate charts
in separate tabs by right clicking on any link, and selecting "open in new tab"
from the menu. The main list of site pages is at
http://daytradingforecasts.com/chartlistsec.asp
Recommended pages to watch are SPKISS, MTRainbow, and Chat.
For astro stuff, add SPSunMoon, Wheel, and Chaos Clinic.
A special set of Dr. Al's research charts are on the Secret page.
Comments in the chat room are announced by a
"duck call" noise. This noise also occurs when the software detects a
resonant hex pattern on the Wheel page. MoonTide trading tutorials
are on the right side of the ListOfCharts page. One should
read Trading the MoonTide Tutorial and Keep it Simple as a minimum.
Many subscribers do not strictly trade the MoonTides, but use the charts on this
site as input to their own trading strategies. For example, charts 5 and 6 on the
SPKiss page are a good starting point for swing traders.
Also on this site is the Certified Chaos Trader's Room. That room is open
to graduates of my 4 main courses. See http://moneytide.com -> Courses for details.
9:00 Eastern-System: No comments