![]()
![]()
**************************************************************************************
Market AstroPhysics Of The 2/2/2023 S&P
Chaos Clinic for 2/3/2023
***************************************************************************************
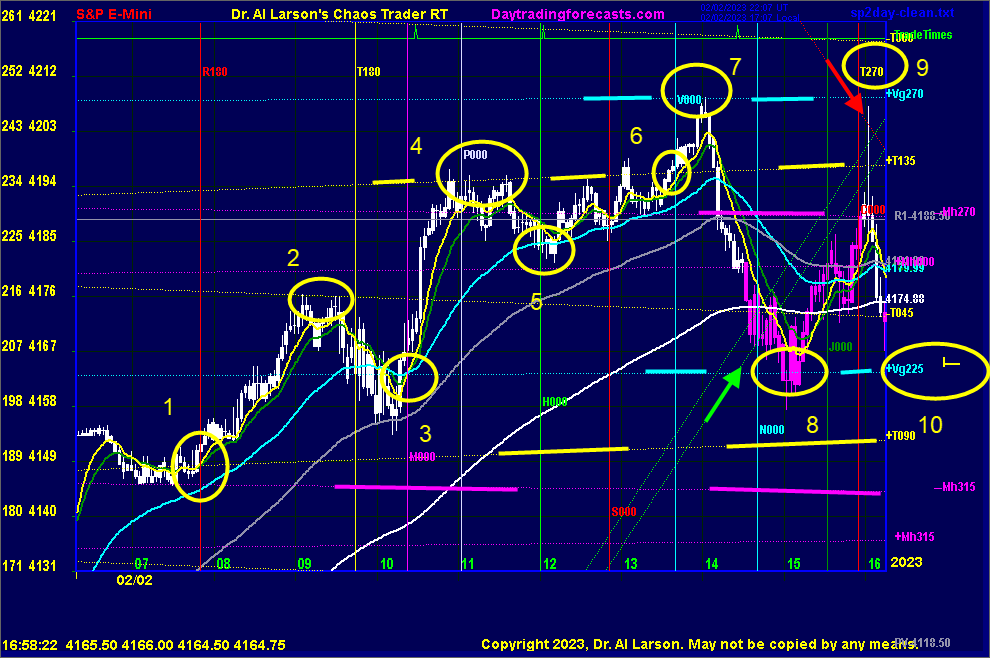
This chart shows the Market AstroPhysics of the S&P futures on 2/2/2023.
This chart the S&P futures with 3 minute candlesticks. These are colored by a 36/220 minute
pair of EXMAs. Up bars are white, down are magenta.
Electric field flux lines are shown as well. Moon are yellow, such as +T135, -T045, etc.
Mercury are magenta, such as +Mh0000, -Mh315, etc. Cyan ones are Venus, such as +Vg270
Five EXMAs are shown, 20 minute is yellow, 36 is green, 110 is cyan, 220 is grey, 440 is grey.
These are use for trading the MoonTide times, which are shown along the top of the chart
by the green line with pippers. Vertical lines are where the rotating earth moves the NYSE exchange
to line up with planets in conjunction (000) or opposition (180). Aspects with the Moon are
shown for 0, 90, 180, and 270 degrees,
On the chart are several numbered circles. These are just numbered for discussion purposes,
and are not any kind of wave count.
Point 1 shows that as the exchange opposed Mars (R180 vertical line) prices found support on the Moon
+T090 flux line. Prices then rallied to point 2, where the -T045 moon flux was resistance. That started a small
decline.
That decline found support on the 220 EXMA, then turned up on the +Vg225 flux ( Point 3) as the exchange conjoined
Mercury. That low coincided with the first MoonTide trade, which was a continuation buy.
The following move was fast, reaching The Moon +T135 flux at Point 4. From point 1, this was a harmonic
45 degree move. Here the move stalled, a cover point for the MoonTtide trade.
Prices sagged to Point 5, then turned up as the exchange passed the Sun (H000) at point 5. Prices
made another dip as the exchange passed Saturn (S000). then broke higher at Point 6 as the exchange
passed Venus. At point 7 prices reached the Venus +Vg270 flux, up a harmonic 45 degrees from point 3.
The following decline was steep, retracing 45 degrees back to the+Vg225 flux at Point 8. The last hour
of trading was chaotic, due to an up going green swan, and a down going red swan (arrows). They are explained
on daytradingforecasts.com. In the last hour, as the exchange squared the Moon at T270, prices shot
up to the intersection of the red and green swans (Point 9) , then dropped sharply back down to
the +Vg225 flux just after the normal session close at Point 10.
For more on my work and to subscribe to Tomorrow's Market Email Hotline and access to daytradingforecasts.com see
Moneytide.com
Software to plot electric field flux lines in NinjaTrader is available at
energyfieldtrading.com
2/3/2023 12:19:16 PM MT Al****:: I'm calling it a day - thanks for coming-take some courses-see you next week
2/3/2023 12:14:27 PM MT Al****:: found support on -Mh315 - down 45 degrees from -Mh270
2/3/2023 11:32:26 AM MT Al****:: and through the crossover- turned all the EXMAs down
2/3/2023 11:18:48 AM MT pab:: Another great call, Al
2/3/2023 11:02:30 AM MT Al****:: dropped into the Moon flux crossover
2/3/2023 11:01:42 AM MT Al****:: OK
2/3/2023 10:33:33 AM MT TJ:: Looks to me like a high at 13:03 then strong drop into 15:30
2/3/2023 10:30:10 AM MT Al****:: today we have a Moon flux cross over - coming up about now
can add energy
2/3/2023 10:24:37 AM MT Al****:: dip at noon and 20/110 continuation buy setup
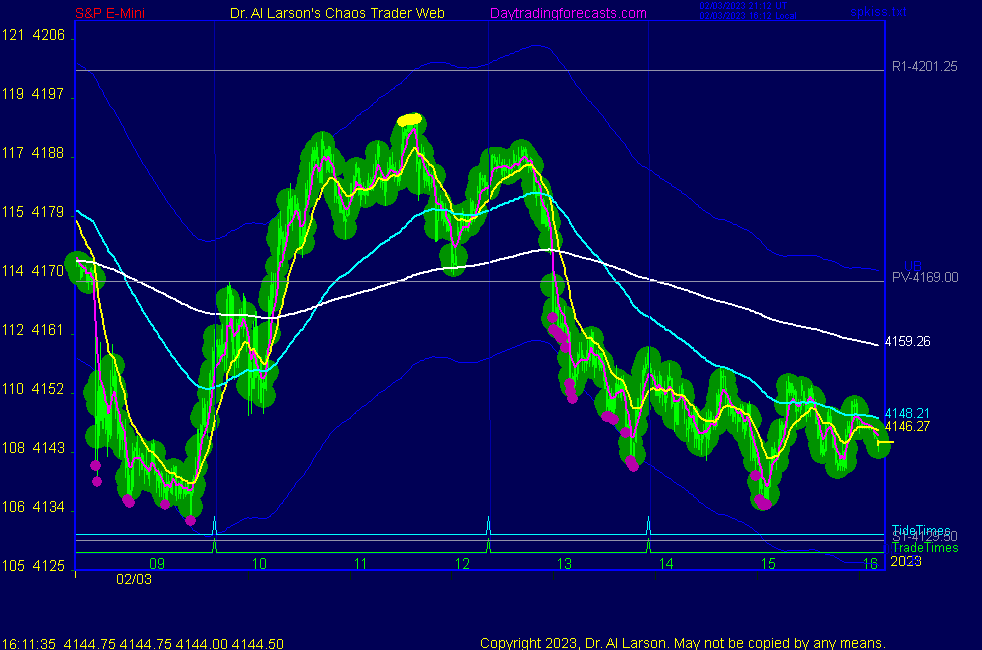
2/3/2023 10:07:21 AM MT Al****:: note on the secret->esnat72 chart the support on the green vibration-earlier in the day it was resistance
2/3/2023 10:03:27 AM MT Al****:: homework from the Chaos Trading Made Easy course suggests buying coming in near 12:10 eastern
2/3/2023 9:53:56 AM MT Al****:: this dip suggests inverting to red -Tide
2/3/2023 9:49:10 AM MT Al****:: coming to solar noon -which may add energy
2/3/2023 9:31:38 AM MT Al****:: that suggests another 45 points up is possible
2/3/2023 9:28:03 AM MT Al****:: trade is now along the +Mh000 flux
2/3/2023 9:15:48 AM MT Al****:: note on the Chaos Clinic chart we are on the green +Tide until the next Tide time - so holding long looks good
2/3/2023 9:09:24 AM MT Al****:: note on secret->esnat72 the rally has gone up 1 magenta vibration level - could go 2
2/3/2023 9:06:38 AM MT Al****:: note that the 36/220 EXMAs have turned the bars white = bullish
and the rainbow of EXMAs is up
2/3/2023 8:28:06 AM MT Al****:: this move was aided by the exchange passing the Mercury and Moon time lines
2/3/2023 8:26:53 AM MT Al****:: finally the 440, 220, and 110 EXMA turned up creating a buy setup near the pivot of 4169 - prices how have hit the +Mh000 flux
2/3/2023 7:45:11 AM MT Al****:: the first Friday employment report often screws up the EXMAs, making finding a good trade setup difficult, so be patient
2/3/2023 7:35:28 AM MT Al****:: and on the +Mh315 flux line
2/3/2023 7:33:52 AM MT Al****:: support came in at the white vibration level on secret->esnat72
2/3/2023 7:17:50 AM MT Al****:: the employment report was knocked down by a red swan
2/3/2023 7:05:25 AM MT Al****:: Good Morning visitors. Welcome to the Chaos Clinic.
The written Chaos Clinic is on the AUX page.
This site has a lot of charts,
so you may find it useful to have several of them available within your
browser. If you have a tabbed browser, you can open separate charts
in separate tabs by right clicking on any link, and selecting "open in new tab"
from the menu. The main list of site pages is at
http://daytradingforecasts.com/chartlistsec.asp
Recommended pages to watch are SPKISS, MTRainbow, and Chat.
For astro stuff, add SPSunMoon, Wheel, and Chaos Clinic.
A special set of Dr. Al's research charts are on the Secret page.
Comments in the chat room are announced by a
"duck call" noise. This noise also occurs when the software detects a
resonant hex pattern on the Wheel page. MoonTide trading tutorials
are on the right side of the ListOfCharts page. One should
read Trading the MoonTide Tutorial and Keep it Simple as a minimum.
Many subscribers do not strictly trade the MoonTides, but use the charts on this
site as input to their own trading strategies. For example, charts 5 and 6 on the
SPKiss page are a good starting point for swing traders.
Also on this site is the Certified Chaos Trader's Room. That room is open
to graduates of my 4 main courses. See http://moneytide.com -> Courses for details.
2/3/2023 6:39:03 AM MT pab:: oh oh, unemployment rate DOWN
2/3/2023 6:33:03 AM MT pab:: Oh Oh Gil Morales - TheOWLTrader.com & VoSI @gilmoreport · 38s January Nonfarm Payrolls 517K vs. 190K http://Briefing.com consensus; prior revised to 260K from 223K.
9:00 Eastern-System: No comments
![]()
![]()