********************************************************************************
Facebook Waves a Red Flag
Chaos Clinic for 2/14/2020
********************************************************************************
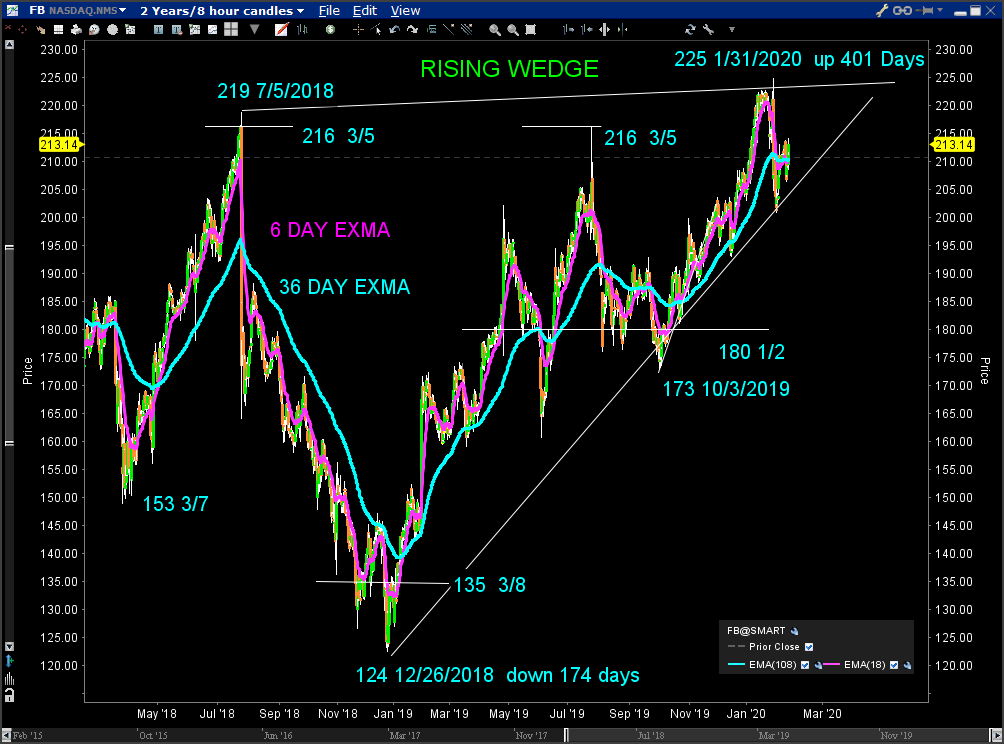
Facebook may be vulnerable to a major downturn. This two year 8 hour bar chart
shows that it has formed a rising wedge. While the 36 day trend is up, it has flattened
after a sharp drop on 1/31/2020. The drop broke back below the 216 level
of prior tops.
That drop came from a price of 225, which is a harmonic 5/8 of a 360 degree circle.
Previous highs in 2018 and mid 2019 were from 216, the 3/5th part of the circle.
Support came in in late 2019 loosely around 180, 1/2 a circle.
The second half of 2018 saw Facebook drop from 219 to 124 in 174 calendar days.
a 43 % drop in less than 6 months, of -5.3 points per day.. The ensuing rally
of 101 points took 401 days, about 4 points per day. The slower rally speed
suggests less energy.
Trendlines along the highs and the lows outline the rising wedge. Trading is now
trapped in the small end of the wedge. Prices may congest within it into June.
But if prices break down below the bottom trendline, a serious decline could occur.
This looks like a trade setup to watch.
For more on my work, see Moneytide.com

2/14/2020 12:47:12 PM MT jbs:: Good news is that it looks like price is heading back down. Bad news is that price hit my 3375.00 stop loss level first. Not sure what I could have done differently. Didn't want to move my stops and increase risk. Anyway, -5.5 net for the day. Have a great weekend!
2/14/2020 12:40:38 PM MT Al****:: I'm done for the day-thanks for coming-see you next week-take some courses-have a great weekend
2/14/2020 12:39:29 PM MT Al****:: stopped for +2.7; was trying for a swing trade, but made sure I had a win
2/14/2020 12:19:23 PM MT Al****:: I lowered my stop to 3375 - just above the 440 minute EXMA -lock in a small win
2/14/2020 12:16:52 PM MT Al****:: looks like still on red -Tide
2/14/2020 11:50:37 AM MT qq:: jbs Time willtell
2/14/2020 11:33:30 AM MT jbs:: Xtide is showing more energy reaching the market around 14:00 and I see a minor red swan upcoming as well. In my novice observation, we will see a nice downturn from here. Thoughts?
2/14/2020 11:28:06 AM MT jbs:: Shorted on 3370.50 sell stop.
2/14/2020 11:25:11 AM MT jbs:: With this strong movement and Al's 1 hour chart observations, I will not wait for a pull back to the 70.67 pivot instead of the 110 to short. Also, the minor green swan did not support price much.
2/14/2020 11:18:37 AM MT jbs:: I'm waiting for a bounce of the 110 to short again. We may be inverting to the green line now. If not, in the next 15 to 20 minutes we may be following the red line down.
2/14/2020 11:03:51 AM MT Al****:: I have posted a Teamviewer test link in the CCTRoom chat
2/14/2020 10:55:30 AM MT Al****:: meanwhile, on hourly chart about to break 72 bar = 3 day EXMA
2/14/2020 10:52:01 AM MT Al****:: thanks guys ; try not to let it go to my head
2/14/2020 10:33:43 AM MT jbs:: Al's work is true and honest. I was a subscriber many years ago and promised myself that when I retired I would get back on board, work hard to learn and make some profit from day trading ES. And, now I am retired, so here I am. We have a great opportunity here thanks to Al.
2/14/2020 10:28:06 AM MT Al****:: nice jbs
2/14/2020 10:23:22 AM MT jbs:: Hit my profit target of 72.50. Covered short for +3.25.
2/14/2020 10:20:30 AM MT jvj****:: Have tried many sites over the years, find Al's studies to be most valuable for day trading. He really has done his homework!
2/14/2020 10:16:39 AM MT jvj****:: That is why I don't use Ninja--too many accounts to monitor. Like to keep trading as simple as possible without data overload!
2/14/2020 10:14:44 AM MT jvj****:: jbs: Yes, I just draw vertical lines on the chart at the trade times. Am using those charts for my trades, as the data is real time. Following Al's charts on this website.
2/14/2020 10:11:39 AM MT jbs:: Al, is there any indication of an inversion to the green tide line upcoming?
2/14/2020 10:08:53 AM MT jbs:: jvj, are you plotting moon tides in thinkorswim?
2/14/2020 10:06:01 AM MT jbs:: I am seeing no signs of moon tide inversion at next 'trade time'. So if price continues to follow the red tide, price will be reversing direction. I'm I missing anything? As for now, I'm targeting 72.50 for short cover.
2/14/2020 9:59:36 AM MT jbs:: Short on 3376 @ 11:54 on 20/110 cross and 110 moving down. This is supported by the red tide and just ahead of 12:15 'trade time'.
2/14/2020 9:56:27 AM MT Al****:: RR, great trade-have a fun day. Thanks for sharing.
2/14/2020 9:55:28 AM MT Al****:: once you are a CCT, we can use the CCT chat room
2/14/2020 9:53:19 AM MT Al****:: send me an email-we can't discuss my courses in a public room
2/14/2020 9:49:59 AM MT jbs:: Al, the FOP overlay is fantastic. I am struggling a little with scaling, but I think I can figure it out. Thanks for the wonderful tool. If I have questions can I send you an email or should I post questions here?
2/14/2020 9:47:05 AM MT jbs:: jvj, but I am not use we are allowed to use that file.
2/14/2020 9:46:06 AM MT RR:: I sold all of my long positions @3380.5. I'm leaving early today to take care of my wife (married for 49 years) and celebrate Valentine's Day. Have a great long weekend all. See you Tuesday AM.
2/14/2020 9:44:07 AM MT jbs:: jvj, current I am putting a vertical line for each 'trade time'. However, I would think moon tides could be plotted in thinkorswim using the tidedata.txt file without much trouble. Are you doing so?
2/14/2020 9:41:55 AM MT Al****:: I have placed my 1 Month 24/7 hourly chart in the Certified Chaos Trader's Room. That room is open
to graduates of my 4 main courses. See http://moneytide.com -> Courses for details.
eMylar Fractal of Pi overlays help you be patient, since they show you future potential moves.
The best bargain in my courses is to take the Cash In On Chaos and Fractal of Pi courses and
learn to use the FOP overlay. Then take Chaos Trading Made Easy, and finish with Face Of God.
2/14/2020 9:40:04 AM MT jvj****:: jbs: I follow most of Al's charts including CCT room. Are you charting the moon tides on Thinkorswim?
2/14/2020 9:33:47 AM MT jbs:: jvj, do you follow the CCT chart room as well or do you just prefer this one? Glad you are here.
2/14/2020 9:22:33 AM MT Al****:: jbs-yes ;t is a 24/7 chart
2/14/2020 9:18:07 AM MT jbs:: RR, good call on long off 70.67 support.
2/14/2020 9:15:13 AM MT jbs:: I am thinking we are seeing a fakeout and price will turn down shortly with strong downward move through 76.
2/14/2020 9:05:18 AM MT RR:: Major obstacle is a bearish parabolic on 15 Min. chart @78.25
2/14/2020 9:03:51 AM MT jbs:: Al, did you count 'after hour trading' bars in your hourly chart with rising wedge observation?
2/14/2020 8:58:33 AM MT jbs:: Passed on 10:54 20/110 cross. With 110 moving up, this is a good signal long. But,with a 11:00 potential red tide turn down I decided to pass on the long.
2/14/2020 8:53:36 AM MT Al****:: Thanks GON
2/14/2020 8:47:53 AM MT RR:: On 10:12, I bought It @ support 70.5. I'll hold It until 80.5 and 84.5
2/14/2020 8:37:19 AM MT RR:: Good bull bar came in 2 10:33
2/14/2020 8:29:30 AM MT gon:: Hi Al, going to publish your analysis, thanks! All the best!
2/14/2020 8:19:35 AM MT RR:: GM all
2/14/2020 8:13:51 AM MT qq:: Forget about firming, still down
2/14/2020 8:13:10 AM MT qq:: Looks like firming near support and maybe fixin to small up
2/14/2020 8:12:03 AM MT kwc:: Good Morning Al'l'
2/14/2020 8:00:48 AM MT qq:: So far Chaos red tide.
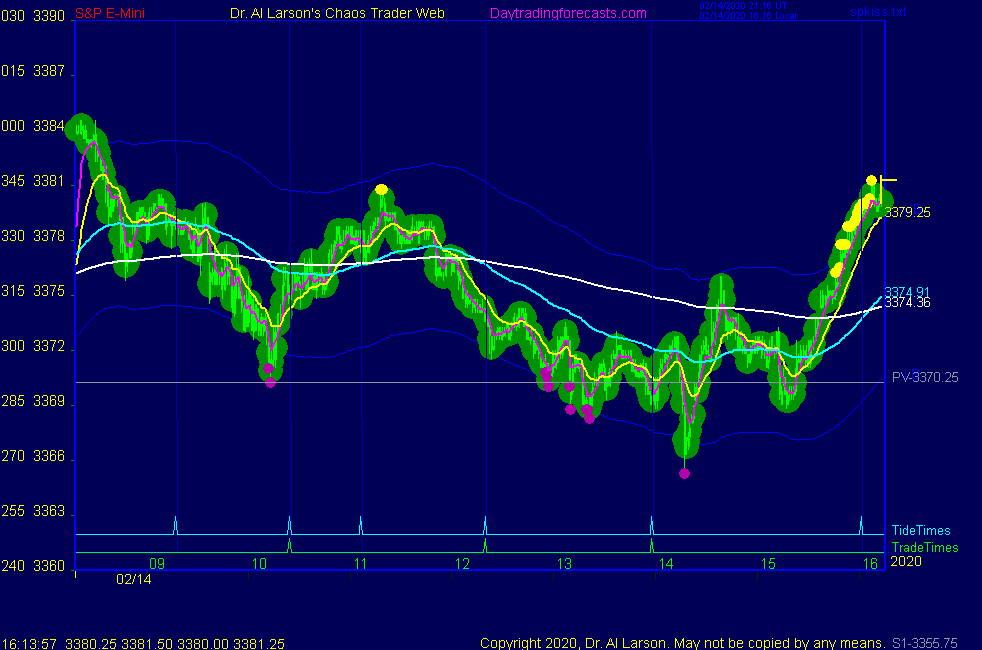
2/14/2020 7:52:22 AM MT Al****:: I did sell 3377.70 (multiple contracts) based on my hourly chart rising wedge,
7 moves up from Sunday night low, 3 drives to a top
2/14/2020 7:41:22 AM MT Al****:: weak opening
2/14/2020 7:39:20 AM MT qq:: GM All
2/14/2020 7:01:00 AM MT jvj****:: Good morning everyone
2/14/2020 6:11:17 AM MT Al****:: GM all - good luck today
Chaos Clinic posted on the AUX page
9:00 Eastern-System: No comments