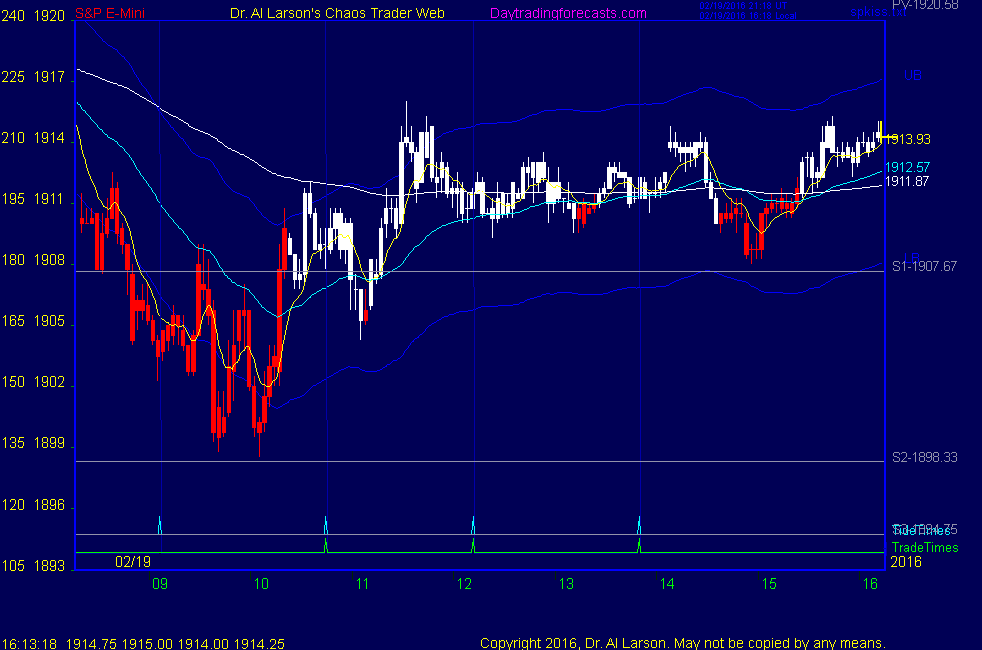


2:28 long may still work, but I have to go-have a good weekend-see you next week-take some courses
2:44 aborting for -.75
2:40 stop OK by 2 ticks-good as a mile
2:25 stop is close-sit
2:31 tested the 440 - hang tough
2:27 notice how the EXMA's are diverging
2:26 now just be patient and let it run
2:19 after 2:30 big traders will cover any shorts since they are not working
2:11 stop to 1909, risk 2
2:08 this demonstrates the value of just one of my unique trading tools - take some courses
2:07 rally is right where the Fractal grid says it should be
2:02 now if we rally, the red -Tide is ibn effect; it is up to the close
2:00 hang in there
1:51 the fractal grid from the Chaos Trading Made Easy course says this is the sleeper buy point
1:35 looking fine
1:26 may be ready to go
1:16 stop OK, fractal grid OK, sitting on my hands
1:07 patience
1:02 still looking good
12:52 looking OK - planning to hold as long as I can
12:40 stop 1908
12:29 bought 1911 stop 1905 for now
12:27 when the market makes a low near 10:00, then holds up 2.5-3 hours, it usually rallies
12:25 I have a Fractal Grid pattern saying up pressure into the close
12:13 now have a 1-2-3-4 up, and support on 440 EXMA-looking to buy again
12:12 got +2 on that one
11:45 back but was on the phone got stopped for -2 but rebought 1909
stop now 1911
10:47 now taking a break - stop is in - let it run
10:35 stop to 1907
10:31 trend had changed to up; the rainbow of exmas is curling up;
10:28 passed Venus 0 timeline, near Mercury 0; see spSunMonnMer chart
10:23 staying-buying 1909 stop 1903; strong buying at S2; 6 hour down move
10:17 stopped out for -6 ; taking a break
10:10 Dow down 113 - could be a 300 point down day
10:00 stop held-have to get past the first move against your position
9:56 A simple way to stay focused is to ask which way the 220 minute EXMA is going; if down, sell the rallies
if sloping up, buy the dips
9:52 lots of high frequency swings as the computers try to get on the right side of things
9:42 I should have just sold s2-oh well
9:39 sold 1902 stop 1908
9:32 rally got prices back up to S1-need to just watch here
9:30 looks like a little rally here-Moon T180 timeline
9:03 this decline started at 4 AM Eastern. It is now well established. The trick for day traders will be to find an entry point. Trade times are 10:45, 12:12, and 13:50. Strategy is to sell the rallies.
8:52 the market has headed lower, selling at the pivot 1920.5 overnight, down to s1 1907.75,
and now breaking that. S2 is 1898.5
8:30 Good Morning. Welcome to the Chaos Clinic. This site has a lot of charts,
so you may find it useful to have several of them available within your
browser. If you have a tabbed browser, you can open separate charts
in separate tabs by right clicking on any link, and selecting "open in new tab"
from the menu. The main list of site pages is at
http://daytradingforecasts.com/chartlistsec.asp
Recommended pages to watch are SPKISS, MTRainbow, and Chat.
For astro stuff, add SPSunMoonMer, Wheel, and Chaos Clinic.
Chaos clinic comments appear at the bottom of the SPKISS, MTRainbow,
and ChaosClinic pages. Comments in the chat room are announced by a
"duck call" noise. This noise also occurs when the sofware detects a
resonant hex pattern on the Wheel page. Trading tutorials
are on the right side of the ListOfCharts page. One should
read Trading the MoonTide Tutorial and Keep it Simple as a minimum.
The next Essentials of Personal and Market Astrophysics will be taught March 21-23. If you want to come, send Al An Email.
9:00 Eastern-System: No comments