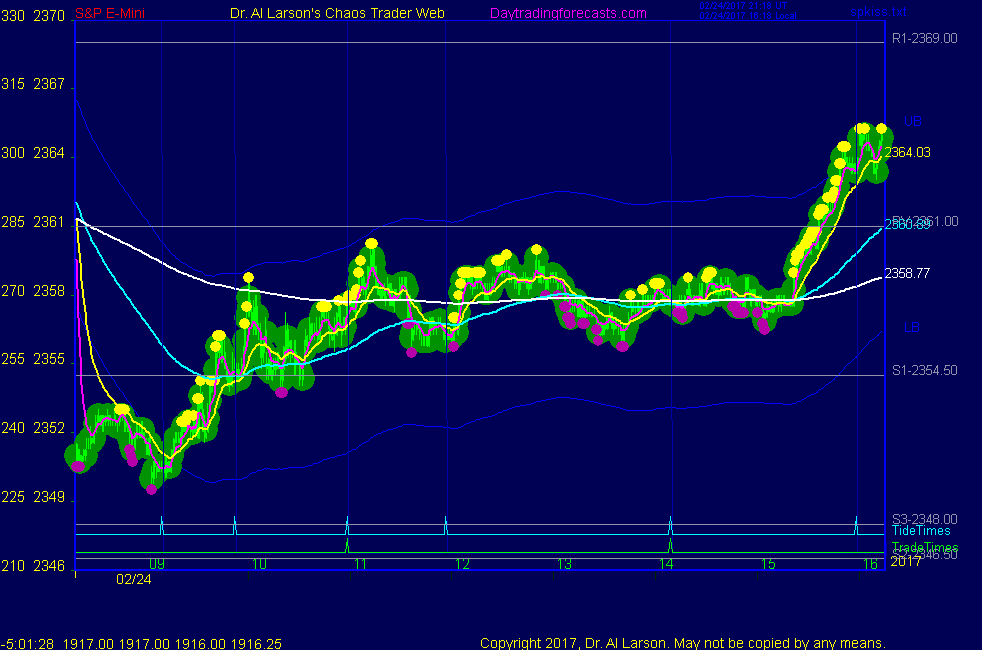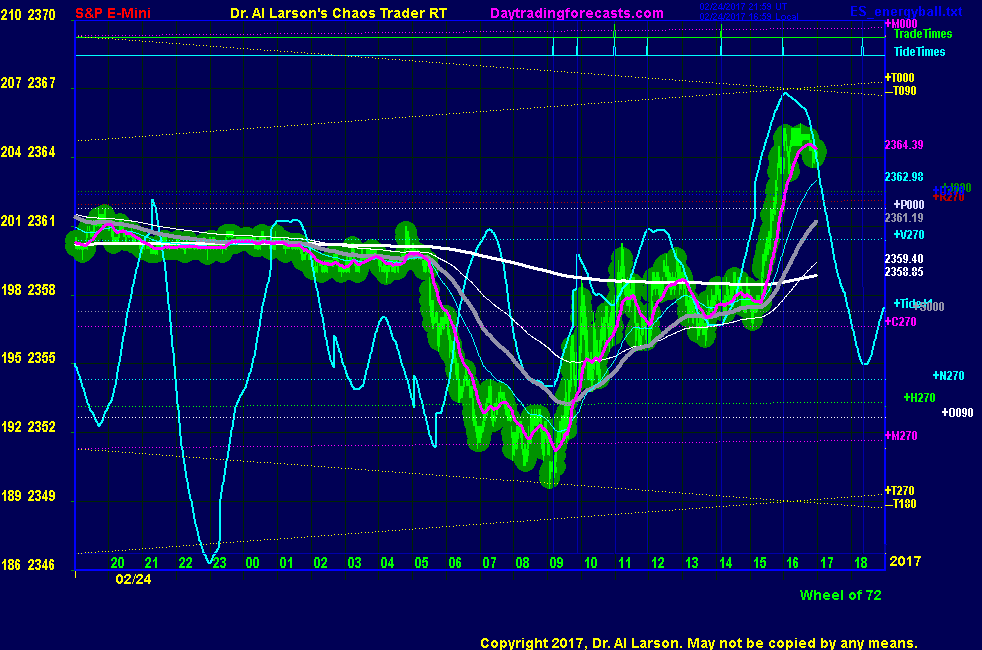


4:03 FWIW: I did come back and get the late rally as per AUX page
2:22 that trade may eventually work, but I have to go shovel some snow; thanks for coming; take some courses
2:20 not going-abort4ed for -1
2:15 I of course do not KNOW if prices will follow the red -Tide down to that point
2:08 on my AUX chart I turned on Wheel of 72 flux lines-note Moon flux crossover at 2349-high energy point
2:01 up to 6 day average; high on exact Tide time; sitting tight
1:52 every trade is a risk-you have to control your losses so you must always us a stop
1:47 lower yellow pushball on SPKISS plasma chart-favorable for the trade
1:43 note how the 220 EXMA has curled over as the 110 did
1:39 looking OK
1:33 stop to 2360
1:24 It's Friday afternoon in NY-the market is lower, you have a lot of stock longs that are profitable
what would you do if you were the fund manager? You just saw Tesla get dumped after earnings news.
1:20 still OK-on AUX chart have turned down under 6 day EXMA; have 20/110 sell, etc
1:15 stop to 2360.5 -above the normal session high by one tick
1:08 trailing stop got me short at 2357.25; putting stop at 2061 for now
1:00 red -Tide still looking good-need to be patient and wait
12:53 If you use Interactive Brokers you can place a trailing sell stop when you think you are coming
unto a high. I find a 3.5 point works pretty well
12:43 on a two day or longer chart We have 1-2-3 now in move 4; want to be short in a move 5
12:39 range of the rally is 11.25 , which is the 32nd harmonic of the Wheel of 360; just noting that
12:36 I personally do not use Elliott wave, but you need to know what users of it will think they are seeing
12:24 on the SPKISS chart with the push balls you can see 5 swings-Elliott wavers will see this as an ABCDE correction
12:15 on a 24 hour chart, a line along the highs and a line along the lows cross near 2:00
apex is usually a turning point
12:10 all the indexes are down a bit-my panel of about 18 stocks are all down
11:56 checking charts-in a congestion-pattern looks like red -Tide; back later
11:28 I'm going to take a break until near the second trade time
11:25 This was a "gap down" day on the regular session-often leads to a rally up into 11:00 Eastern
11:22 glad I aborted-taking a break helps one stay detached and calm
11:02 taking a break
11:01 aborting for -2.5 ; not working
10:54 coming to exact trade time-I could have waited
10:50 I have placed a Face Of God chart in the Certified Chaos Trader's Room. That room is open
to graduates of my 4 main courses. See http://moneytide.com -> Courses for details.
eMylar Fractal of Pi overlays help you be patient, since they show you future potential moves.
The best bargain in my courses is to take the Cash In On Chaos and Fractal of Pi courses and
learn to use the FOP overlay. Then take Chaos Trading Made Easy, and finish with Face Of God.
10:43 stop back to 2359
10:34 getting "duck call" sound-hex pattern recognized by software-see Hex Wheels Today and Hex Wheels tutorial
linked on right side of list of charts page
10:32 stop to 2358 - risk 3 points
10:27 trading at about the 50% retracement - that often attracts selling
10:18 one does need to read the pattern and not just watch the EXMAs - this is a down thrust followed by a
corrective rally that was smaller-EXMAs are converging
10:15 stop to 2359-just above the high and the 6 day mean
10:13 sold 2355 stop 2360 for now-faster EXMAs turning down
10:10 that rally was a tick over 9 points, 9th harmonic of Wheel of 72
10:07 the top of that move on the SPKISS chart has an isolated push ball-signs of exhaustion
10:03 on my AUX chart, the heavy white EXMA is the 6 day mean-stopped the rally
10:01 lots of juice due to the Moon timeline near 10:20 -still just watching
9:52 looks like the start of a sideward congestion on S1=2354.5
9:47 the Tides show a lot of chop early, which usually means short moves that fail to gain support
9:41 have a 20/110 buy crossing, but not a trade-the trend is down and we want to trade with it
also too far from trade time
9:35 the 220 minute EXMA ( grey on AUX )was resistance, so 440 (thin white) is a good stop guide
9:32 early pop up-watch for it to fade
9:29 that chart shows a nice EXMA rainbow divergence starting about 5 AM Eastern. Trend is down
The Flash boys sold the 2361 pivot.
9:26 I'm showing the chart I'm trading on the AUX page
9:18 as mentioned in last night's email, yesterday looked like a top to me and apparently to others,
with the market selling off overnight. This may make it hard to get good day trades, at least until late.
Trade times are 10:59 and 14:09
9:00 Good Morning. Welcome to the Chaos Clinic. This site has a lot of charts,
so you may find it useful to have several of them available within your
browser. If you have a tabbed browser, you can open separate charts
in separate tabs by right clicking on any link, and selecting "open in new tab"
from the menu. The main list of site pages is at
http://daytradingforecasts.com/chartlistsec.asp
Recommended pages to watch are SPKISS, MTRainbow, and Chat.
For astro stuff, add SPSunMoonMer, Wheel, and Chaos Clinic.
Chaos clinic comments appear at the bottom of the SPKISS, MTRainbow,
and ChaosClinic pages. Comments in the chat room are announced by a
"duck call" noise. This noise also occurs when the sofware detects a
resonant hex pattern on the Wheel page. Trading tutorials
are on the right side of the ListOfCharts page. One should
read Trading the MoonTide Tutorial and Keep it Simple as a minimum.
The next Essentials of Personal and Market Astrophysics will be taught March 20-22. If you want to come, send Al An Email.
9:00 Eastern-System: No comments