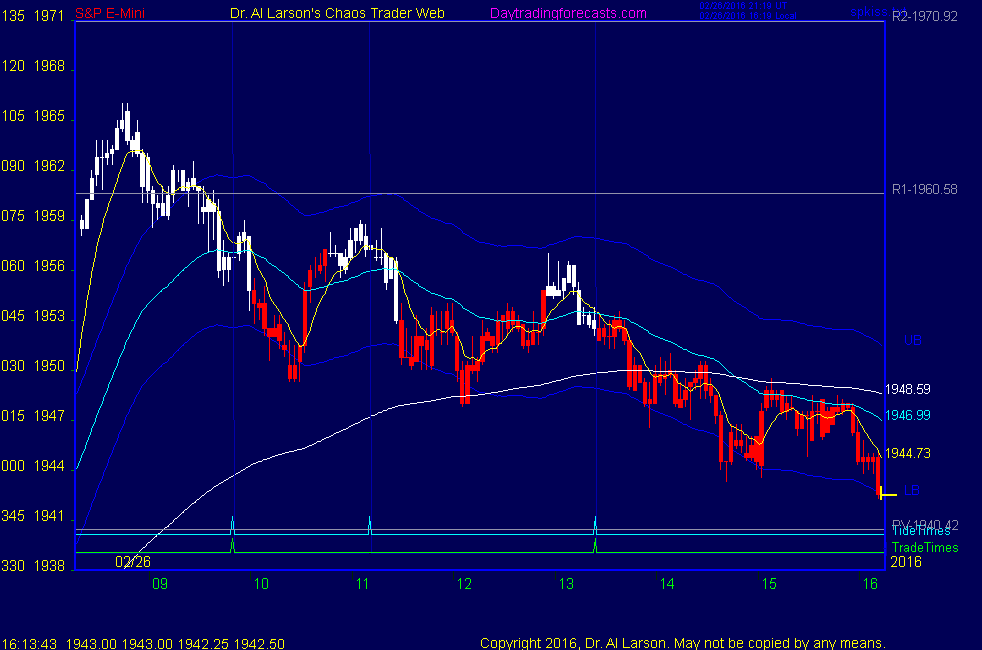


3:08 I'm done for the day-thanks for coming-see you next week-take some courses
3:07 out for +4
3:06 sill OK stop to 1949 - lock 4
2:45 stop to 1950-lock 3
2:41 that Moon flux cross over did it -stop to 1950.5
2:40 stop now to 1951
2:32 hanging tough-coming to crossover in Moon flux-next 9 points can come fast
2:20 looking good-watch for a vertical streak on the Moon T180 timeline near 3:00
2:16 patience
2:05 so far so good
2:00 stop now to 1953-break even
1:56 notice now how the EXMAs have diverged
1:52 I now expect this move to accelerate
1:47 stop now to 1954.5
1:43 there it is
1:40 I expect more selling soon
1:30 we need more Lerts :)
1:25 stay alert now
1:16 sold 1953 stop 1958 for now
1:10 a high here matches the green +Tide, which is down to close
1:04 this is where rallies started last two days - if fail to get a rally going, could see a move 5 down
12:57 getting some buying-may be "pop corn noise" - as in communications channels
Mandelbrot discovered Fractal Geometry studying noise in communications channels-
12:48 putting a sell stop at 1950.5, 2 ticks under last minor low; if hit, my buy stop will go in at 1956
12:38 about 1:20 there is a peak in Xtide, coinciding with next trade time; looking for a continuation sell then
12:37 I covered because we got some lift off the Green Swan-probably temporary
12:32 OK, taking +3 here
12:12 the retracement guys sold a 50% retracement; they will look for a Fib target of 1.618, about 1938;
I don't use Fib retracements, but it is good to know what those who do are thinking
12:05 the computer guys sold R1; pivot is 1940, s1 balance is 1920
12:03 stop now to 1956 - drop is moving
11:44 stop to 1959.25
11:40 my mistake was giving up on my first entry when I came back from breakfast
11:30 resold 56 stop 62 - got a second continuation sell; now it looks again like a down to close day
11:18 from the high we had an ABC correction which found support at yesterday's close
suggests flat to up for rest of day
11:06 prices have now gone flat , so nothing to do but wait for the second trade time
10:59 aborted for +1 - got enough buying to hold it up-my breakfast cost me :)
10:52 from the morning high I see a 1-2-3 and now in 4 moves of a down Chaos Clamshell, so trying to hold short
10:45 trade is below the longer EXMA's on my 24 hour charts
10:38 back from break fast- got fast bounce against the trade; have not yet moved stop
9:44 this is one to let run all day-taking a breakfast break now
9:42 got hit by a Red Swan
9:35 rolled over, sold 1958.25, stop 1962.75
9:15 the first trade is setting up as a buy
9:02 once the Flash Boys stop get out, prices usually make a counter move, so again it is hard to manually take profits quickly
8:52 The Flash Boys (read the book by that name) trade the reports with super fast computers; You cannot manually
enter in time once they pounce; but the computers just follow the energy, which always sets up the trade.
8:42 I'm sorry that I can't tell you all I'm doing here-too busy just doing the trading. But what I can tell you
is that you can learn to find the energy centers by taking my Face Of God course.
8:38 I don't try to trade the reports, but I do trade FOG patterns; my average entry was 1960.25
8:33 And now the good GDP report adds energy; FOG showed the buy setup BEFORE the report
8:30 that low had a good Face Of God setup; the Face Of God pattern helps you find energy centers
Prices are attracted into the enter, then repelled away from it
8:18 the overnight high was near 5:00 Eastern, followed by a 3 hour decline, which is likely over
That decline has 7 little moves in it
8:13 trade is near the R1 price of 1960.5
8:10 the 3 day trend is up, and the market rallied overnight. I expect some congestion
today, with further rally sometime today.
8:08 Good Morning. Welcome to the Chaos Clinic. This site has a lot of charts,
so you may find it useful to have several of them available within your
browser. If you have a tabbed browser, you can open separate charts
in separate tabs by right clicking on any link, and selecting "open in new tab"
from the menu. The main list of site pages is at
http://daytradingforecasts.com/chartlistsec.asp
Recommended pages to watch are SPKISS, MTRainbow, and Chat.
For astro stuff, add SPSunMoonMer, Wheel, and Chaos Clinic.
Chaos clinic comments appear at the bottom of the SPKISS, MTRainbow,
and ChaosClinic pages. Comments in the chat room are announced by a
"duck call" noise. This noise also occurs when the sofware detects a
resonant hex pattern on the Wheel page. Trading tutorials
are on the right side of the ListOfCharts page. One should
read Trading the MoonTide Tutorial and Keep it Simple as a minimum.
The next Essentials of Personal and Market Astrophysics will be taught March 21-23. If you want to come, send Al An Email.
9:00 Eastern-System: No comments