
Chaos Clinic Recap
Here are Al's comments
**************************************************************************************
A Possible Golden Opportunity
Chaos Clinic for March 15, 2019
***************************************************************************************
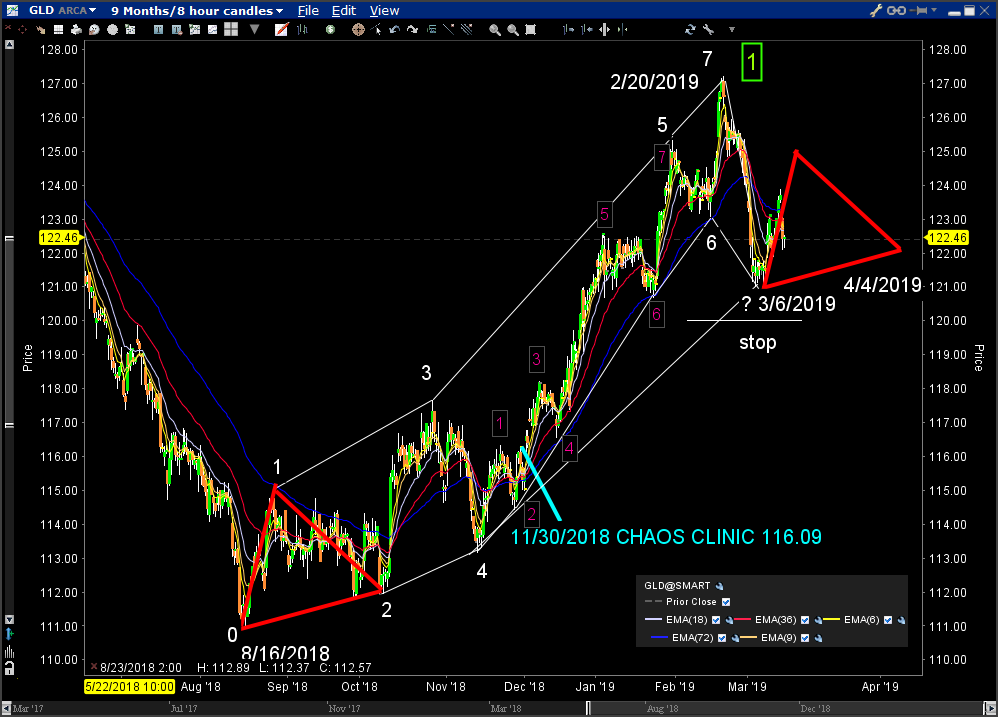
Since the gold ETF GLD was discussed in the November 30, 2018 Chaos
Clinic, it has completed the forecast 7 moves in an Up Chaos Clamshell.
This is shown on the chart above. In November, I expected the rally to last
"into February."
The rally was steeper than I expected, due to move 5 becoming a 7 move
Up Chaos Clamshell itself. This is shown by the red boxed numbers 1-7.
This is a good example of the fact that move 5 in a Chaos Clamshell is often
the largest and fastest and best to trade.
The moves 6 and 7 were quick, with move 7 being an obvious blow off.
From there prices dropped sharply into March 6th.
So what now? The most likely pattern is a consolidation, before further advance.
I think the approximately six month rally from August to February is move 1 of
a much larger Chaos Clamshell. This is shown by the green boxed number 1.
One way to estimate the duration of this consolidation is to anticipate that it
might look like the August through October 2018 move, outlined as a red triangle.
This triangle has been copied to the end of the chart. It suggests GLD could
congest until about April 4th.
If prices do this, it could be a golden opportunity to buy gold for further advance
near the end of the triangle. Purchases can be protected with a stop at 120.
The GLD Exchange Traded Fund is my preferred vehicle, since it can be traded
by small accounts. .
To learn more about Chaos Clamshells, I suggest my Cash In On Chaos course,
available at Moneytide.com
Besides the comments made by Al, the chat room has live
comments from other traders who sometimes share their views,
trades and tips. Below are the chat room comments from this clinic
3/15/2019 1:56:47 PM MT gg:: It did it - went below 2826 Yellow Horizontal line on Secret. That chart wasn't up last I checked, but still it's for sure below it now.
3/15/2019 1:35:51 PM MT gg:: Will it did below 2826 Yellow Horizontal line on Secrete.
My guess is yes.
3/15/2019 1:34:03 PM MT gg:: Chaos chart approaching 2nd vertical blue line. Also, could it break downward with vertical red tide line?
3/15/2019 12:41:31 PM MT gg:: Coming on Chaos to vertical moves of red and green tides
3/15/2019 12:39:40 PM MT gg:: On Chaos +T1000 line support
3/15/2019 12:36:12 PM MT gg:: Lower High forming?
3/15/2019 11:04:06 AM MT Al****:: have to leave now - have a small emergency-have a good weekend
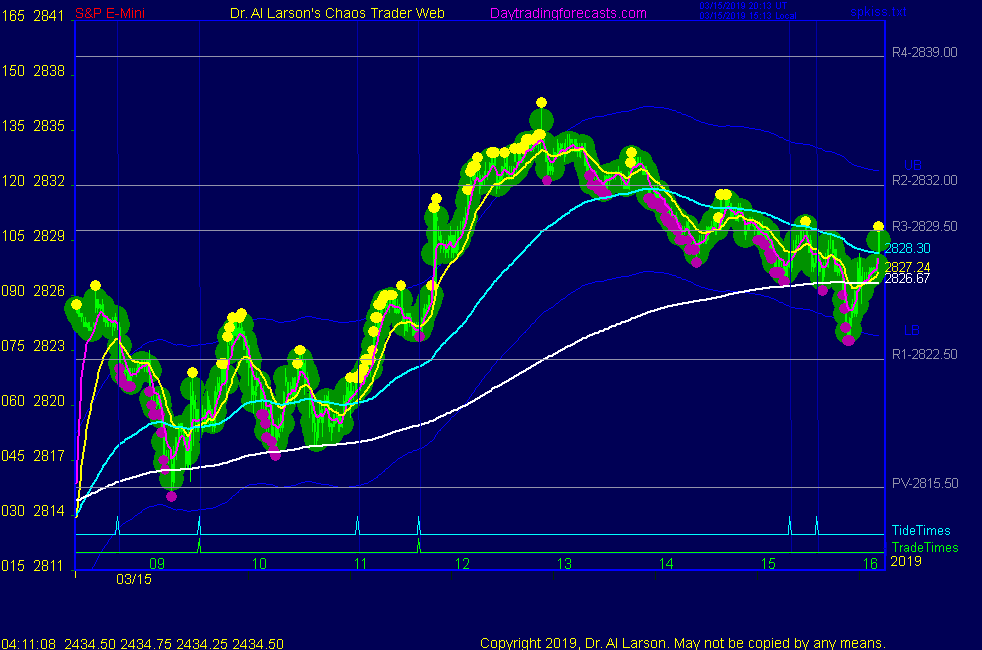
3/15/2019 10:54:23 AM MT Al****:: the last chart on the SPKISS pages shows this could be a move 5 up from last Friday-note the support from the white 6 day EXMA
3/15/2019 10:44:21 AM MT Al****:: the last one is in the final hour
meanwhile NVDA, subject of prior clinic, looks to have started move 5 up on 8 Hr chart
3/15/2019 10:42:32 AM MT Al****:: the last two up thrusts were from the vertical parts of the +Tide
3/15/2019 10:38:31 AM MT Al****:: triple top was broken so could rally strongly now
3/15/2019 10:26:51 AM MT ghb****:: RR have you studied the list of charts page for the trading moon tides tutorial?
3/15/2019 10:21:20 AM MT Al****:: either can be in effect - that's what produces chaos-just use the trade times and the tracking EXMAs
3/15/2019 10:20:43 AM MT RR:: There is valid resistance @2833
3/15/2019 10:18:36 AM MT RR:: Dr. Al, In SPKISS, do you follow red or green tide?
3/15/2019 10:05:53 AM MT Al****:: third chart on SPKISS page shows clear MoonTide continuation buy in the EXMAs
3/15/2019 9:24:22 AM MT gon:: All right. Besides we have similar patterns in Yen-quoted cross currency pairs (like USDJPY, NZDJPY, etc.) negating this marginal higher high in the blue chips.
3/15/2019 9:08:42 AM MT Al****:: GON: the higher highs are marginal , so I don't read them as all that bullish
3/15/2019 9:00:02 AM MT gon:: Good morning! The broader indices as well as international ones are conforming the bigger topping pattern we discussed last week. Does it conflict when, like in this case, the SP500 and Nasdaq have made higher highs?
3/15/2019 8:24:09 AM MT Al****:: taking a break -looks like typical witching day twitching
3/15/2019 8:16:10 AM MT Al****:: looking weak
3/15/2019 7:40:20 AM MT Al****:: neither-EXMAs are mixed
3/15/2019 7:32:10 AM MT Al****:: it is on the Aspect page, 10th line down
3/15/2019 7:30:27 AM MT RR:: Dr. Al, what would be the signal @9:32, a buy or sell?
3/15/2019 7:30:26 AM MT Al****:: it's not on a chart
3/15/2019 7:26:22 AM MT RR:: Dr.Al, where is the chart for Mercury/Moon cycle?
3/15/2019 7:17:43 AM MT RR:: GM all
3/15/2019 7:11:43 AM MT Al****:: the down turn came on a Mercury/Moon cycle.
3/15/2019 7:09:13 AM MT Al****:: ghb: those vertical moves in the Tides are mathematical discontinuities. They basically are like price gaps. So yes, many of them can warn of POSSIBLE chaos
3/15/2019 6:57:28 AM MT ghb****:: It always amazes me to see a tide just kick the ES in the butt. right on time on the first pre market. the vertical moves in the all the tides today are not normal - Al i know the vertical moves can bring streaks, does having a lot of them like today make you think we are going to be very volatile? XTIDE2 is almost straight down from the open today
3/15/2019 6:48:57 AM MT Al****:: topped on Moon -T315 electric field flux line
3/15/2019 6:47:56 AM MT Al****:: Triple top with Wednesday and Thursday
3/15/2019 6:25:41 AM MT jvj****:: Good Morning Everyone!
3/15/2019 6:20:27 AM MT Al****:: GM all-good luck today
Chaos Clinic is posted on the AUX page.
Today is Quad Witching Day, when 4 different option dates expire at once.
These days are often dull.
9:00 Eastern-System: No comments


[ Live Clinics on Friday on DaytradingForecasts.com ]