
Chaos Clinic Recap
Here are Al's comments
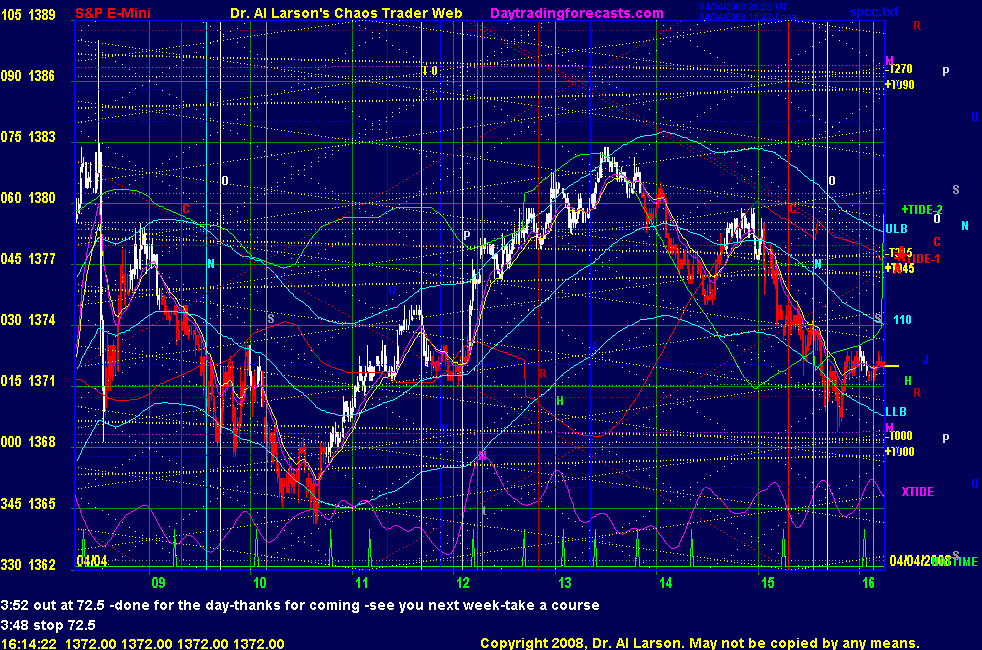
3:52 out at 72.5 -done for the day-thanks for coming -see you next week-take a course
3:48 stop 72.5
3:43 stop 74
3:41 my 9 point cover is 67-may be more here but it is late in the day
3:39 stop 75
3:36 13 3 minute candles is almost 40 minutes-if don't rally in 13 bars, expect another drop
3:31 with the tripling of volatility, there are now Extended Larson Bands at 110 +/- 13.5 points
3:27 stop 75.5 -will cover at 4:00
3:20 the red -Tide says hold until close-I'll try
3:14 stop 77
3:13 looking OK-an indicator from my Chaos Trading MAde Easy course tells me significant buying is done
3:07 the mid day high has held for over 90 minutes, so the Sun's 16th harmonic cycle has turned down
3:03 resold 76 stop 81
3:02 back-looking weak
2:46 my method for waiting is to leave-give my brain and eyes a rest-I set a kitchen timer
and take it with me-back in 20
2:42 now it's back to waiting-20 to 40 minutes to see if we get a resell
2:39 looks like we may have inverted to red -Tide-if so last hour should be down
2:37 out +1.5-may resell-stalling
2:28 stop 78.5-at the 55 minute EXMA
2:19 yesterday's high and the two today make a "3 drives to a top" pattern
2:16 made a marginal break of yesterday's high but could not hold it-bearish
2:11 notice how the 110 EXMA has curled down, with price piercing the top of the dome-means the 110minute cycle has turnd down
2:08 all I'm watching now is the SPKiss chart; 1371 will be support if not broken in next 30 minutes
2:06 looking OK -stop to 82.75
2:04 the high has held for 40 minutes -bearish
2:01 that stop entry got me in before a 20/110 crossing- so now I want to move my stop in about 30 minutes
1:53 elected short 78.5 stop 83.5, .5 above the high
1:52 big top wick on 3 minute candle
1:49 if we continue to rally, We would need a protective stop-a sell stop about .5 under the last low would be good
so placing a sell stop at 1378.5
1:44 -faltering-now, will we get a sell signal, and will we get a following?
1:40 trading is a waiting game - right now waiting to see if we falter at this high
1:34 if we don't make a high above this one within 40 minutes, we should see a bear attack
1:32 struggling at the 3/4 retracement
1:29 we are 6 points above the 110 EXMA-too high for a good buy-so wait and watch
1:26 coming into the exact Tide time-I'm wating to see how we come out of the turn
1:19 high came as passed solar noon
1:15 for a decline to get going, it will have to get below the 1377 Moon flux pinch area
1:09 turned down from Saturn et all flux bundle-watching to see if we get some momentum and a 20/110 sell
12:53 following the green +Tide for now , so possible top-if so, the 20/110 will confirm
12:50 this point is also yesterdays' high - resistance for now
12:46 going into the trade time we are up, at a 2/3 retracement of the BIG BAR early in the day
a 2:3 retracement is the "perfect fifth" from the musical scale - a harmonic point
12:39 got a nice streak up the vertical magenta M= Mercury timeline to give the rally a boost
12:31 posted a chart in the Certified Chaos Trader's room-if you have taken my 4 basic courses, you are a CCT
you can log in with your last name and email address as your password to access the CCT room-can do it in a separte browser window
11:55 I'm going to take a break for about an hour
11:27 on the wheel you see X-the exchange- it has to move pas this cluster to end the congestion-after 1:00
you can see the clock in the center of the wheel-so we need to wait for the earth to rotate
11:24 if you look at the Wheel of fortune, you see 5 planets holding price in a narrow range
see the tutorial on the Wheel of Fortune
11:02 I was stopped at 70.5 - tells me the specialists need to hold it up for a few hours
that means I get a second chance at the next trade time at 1:28
10:59 this rally is peaking 55 minutes from the last one-a Moon time cycle-see the tutorials on this site
10:52 so far, stop is OK-the volatility tripled last July, so what was a 3 point stop now is a 9 point-
one has to adjust to the volatility-hard to do if one does not understand the psychology of risk
10:48 We had an opening BIG BAR, followed by a 50% retrace, then a break of the BIG BAR low; this is bearish
10:40 stop to 70.5
10:32 now I just have to wait for the trade to develop-it works or it doesn't
10:27 A typical day has a 3, 4, 5, or 6 hour fractal. Midway there is congestion or a counter move.
My MoonTide forecast also tells me how long to be patient-moves normally run from Tide turn to Tide turn
10:24 I know that I am an impatient person-I have a tendency to not wait for a move to fully develop
I also know that there are fractal patterns that develop, so I use these to see how long I need to wait
10:20 I took my first stop off the last high-now I see from the 110 EXMA that I can lower it to 71.75
10:18 elected short at 65.75 stop 74.75 - wide for now
10:14 I know that I have a tendency to over-trade on Fridays-so I want to be careful;
I know that after a runnup, the specialists need time to distribute their longs, and they like to do that on Friday
10:09 looking weak again-entry stop is in; if hit, my stop will go at 1374.75
10:05 If my head is clear, I can see better what the market is doing. Then I can apply the
knowledge collected over the years, because I am stress free. One has to understand how the market
behaves, and how you behave. Both are chaotic systems - yes, you too can "go chaotic."
10:00 I test these beliefs using my dowsing chain-see the video at the end of Best Talk Ever on
http://moneytide.com/hans/index.asp for a demonstatration.
I reprogram any negative belief using techniques from the basic Psych-K course-see http://www.psych-K.com
I suggest all traders find their nearest instructor and take the basic course.
9:55 Every morning before trading, I like to test a set of beliefs to see if they are positive.
The first one I check is "I deserve to be rich." The second is "I am worthy of being rich."
9:51 support came at 1368, so no big drop for now
9:45 The greatest impediment to trading well is your belief system-if all your beliefs are
not positive, no tools will make you trade well.
9:41 placing sell stop at 1365.75 - if that is hit, the two day trendline is broken
9:38 I was asked last week what I thought was the thing a sucessful trader needed most
my answer was "A clear mind"
9:34 starting a bit weak-I want to see a break of the lows before getting interested in a short
9:03 early swing hit low on Moon/Mercury et al, high on same +90 degrees- probable trading range day
9:00 Good morning from Chaos Manor
Besides the comments made by Al, the chat room is has live
comments from other traders who sometimes share their views,
trades and tips. Below are the chat room comments from this clinic
4/4/2008 2:44:22 PM Mountain GD:: anyone stilll around?
4/4/2008 1:27:20 PM Mountain Al:: don't know-just want whatever it gives
4/4/2008 12:36:29 PM Mountain Ben:: Al, this is a slow mover. Are you going for a 9 pointer?
4/4/2008 12:31:04 PM Mountain Al:: you don't need to overlay the lines on your own chart, just watch the ones on this site, which you can do daily with a subscription
4/4/2008 12:29:47 PM Mountain Al:: bolinger bands suck-they blow up on fast moves-the Larson bands are jsut the EXMA +/- so much-maker a 3x5 card with the sistance, and use it to measure on the screen from the EXMA if your software won't let you add a bias to the EXMA
The only way currently to overy the Tides on your own chart is to use something like Wave59, which can do it, and get the MoonTide sofeware to generate the data files.
4/4/2008 10:53:44 AM Mountain GD:: Thank you MM. Now I have a question about creating the Larson Bands. My charting software can do Bollinger bands but not the Larson bands. Can you help with that creation? In addition, is there a way to overlay the moon tides chart with one's own spx chart for precision or does everyone just eyeball it?
4/4/2008 10:52:26 AM Mountain Al:: you are welcome MM. Thanks for monitoring the techncrap-I can't always keep up with every way it can break :)
4/4/2008 10:49:54 AM Mountain mm:: Al - thank for fixing the SP1Day
4/4/2008 10:46:47 AM Mountain mm:: It is my understanding that the Moon Tides never change - Al can calculate them indefinetly into the future. - As to today: Since the TIDES have been hot so far, I am going to "gamble" on that the 13:28 is going to be a SELL
4/4/2008 10:23:23 AM Mountain GD:: Al,
Just so I understand this correctly...you provide the moontides chart the nightly and we use that chart in conjunction with our own price charts to create and find trades correct? If so, aren't the moon tides prone to change during the trading day? How do we know about changes and updates?
4/4/2008 9:50:18 AM Mountain GD:: thanks Al...
4/4/2008 9:46:15 AM Mountain Al:: on the right side of the list of charts page are several tutorials-start with Trading the Moontide-be sure to read the one on Keep it Simple
4/4/2008 9:28:49 AM Mountain GD:: Very interested in trading with Al but have no idea where to start..
4/4/2008 9:27:55 AM Mountain GD:: Hello,,new to the room
4/4/2008 9:23:43 AM Mountain Al:: M-fixed the pivot prices-my end of day data collector failed-does so intermitantly now, after working well for many years-need to write an audit program
4/4/2008 8:59:02 AM Mountain mm:: The first TIDE CIT was right on the money - so the 10:22 may be a low
4/4/2008 5:03:29 AM Mountain mm:: Al - SP1Day has not yet updated - thanks
4/4/2008 5:02:52 AM Mountain mm:: gm all - have a grat day
9:00 Eastern-System: No comments


[ Live Clinics on Friday on DaytradingForecasts.com ]