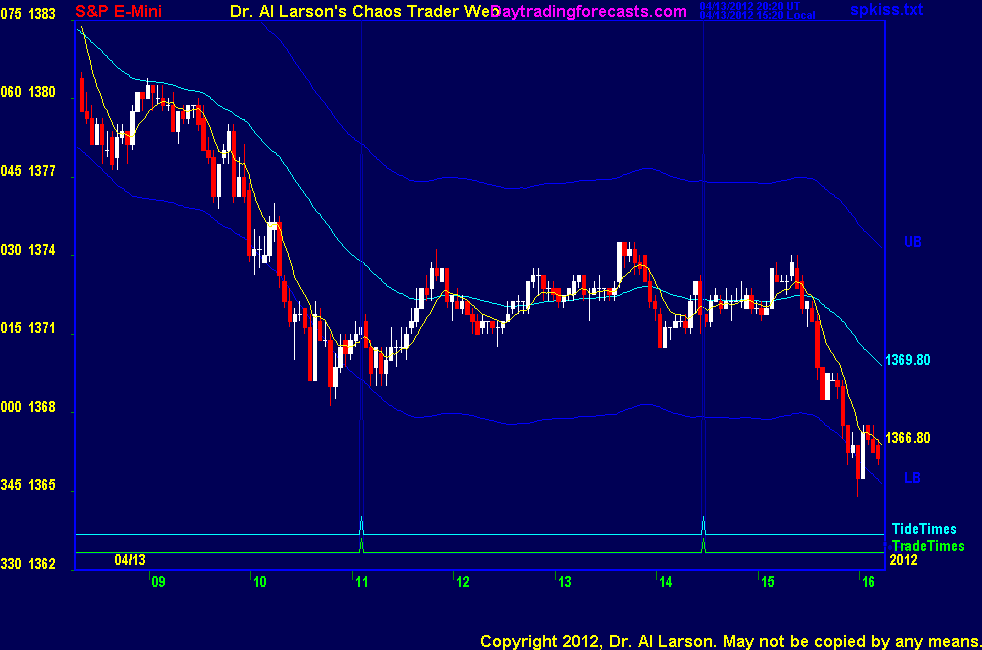


2:06 OK, that's my planned trades for the day-I'm done. May rally later. Thanks for coming.
see you next week- take a course
2:01 aborted for -2
1:58 looks like I jumped too soon - waiting
1:45 taking this as an early continuation buy at 1373.75 stop 1371
1:43 coming into the trade window
1:39 up to the Moon flux
1:33 prices have now held up long enough to attract more buying, so new lows are not likely
1:29 if prices can get above the Moon +T090 flux, it could carry prices higher, perhaps over the weekend,
Since that flux moves up to about 1381, conjoining Chiron
1:15 looking more and more bullish as the 110 EXMA curls upward; may hold up into the close
1:08 during dull periods like this one of the better tools to use is the Fractal grid from the Chaos Trading
Made Easy course - posted a grid in the CCT Room
12:58 these are the mid day doldrums
12:49 back up to Moon/Sun/Saturn flux
12:42 looks like we hold up into next Tide time, then maybe decline
12:40 posted a Fractal of Pi chart in the CCT room
12:28 out for -1.5
12:24 stuck in the mud
12:05 volatility has died down-look to be attracted to the Sun/Saturn/Moon flux bundle due to the T square
11:55 the 440 EXMA is overhead at 1375.70, so I will cover 1375 if get there
11:51 stop to 1370.5 ; made it back up to the Moon +T090 flux
11:42 coming out of Tide time, buying 1372 stop 1368 on 20/55 EXMA crossing
11:22 I have placed a Face of God chart in the Certified Chaos Trader's Room. That room is open
to graduates of my 4 main courses. See http://moneytide.com -> Courses for details.
11:17 Uranus +U000 flux looks like support
11:14 passed exact Tide time-watching to see if low holds
looks like tracking red -Tide so may get a corrective rally
10:59 low is exactly 18 points from yesterday's high, a 90 degree move on Wheel of 72 so harmonic support
10:54 covering for +1 - don't like it here - rate of movement is slowing coming to exact Tide time
10:53 stop to 1372.5
10:50 new lows-support near 1363 on the Moon -T090 flux
10:45 note that the 55 minute and 110 minute EXMAs on the MTRAinbow charts are straight lines now - shows stong move
10:38 stop to 1374
10:36 the slope of the decline is very steep, so this could be a gully washer
10:33 trend is now down for the day-when 110 crosses 440 like that it means move has some strength
10:30 stop to 1375, at the 55 minute EXMA
10:23 in trade window-sold 1371.5 stop 1376
10:21 new lows-watching to see if it recovers to the Moon flux
10:13 often get early head fake on Fridays. May now hold up - trade has stayed between Moon -T000 and +T090 electric field flux
10:04 support for now on the Moon +T090 flux
9:57 on the MTRainbow chart the white 440 minute EXMA is turning down, and the 110 may cross it - bearish for the day
9:47 Tuesday was a high volatility day. Wednesday was low volatility. Thursday was high volatility. Today may be low volatility.
9:42 MTRainbow chart shows support near 1374
9:40 outcry session beginning with some selling-possible support near 1373 at thh Moon fluxline +T090
9:26 today's trade times are 11:06 and 14:28 , so today we watch for a while
9:15 Good Morning. Welcome to the Chaos Clinic. This site has a lot of charts,
so you may find it useful to have several of them available within your
browser. If you have a tabbed browser, you can open separate charts
in separate tabs by right clicking on any link, and selecting "open in new tab"
from the menu. The main list of site pages is at
http://daytradingforecasts.com/chartlistsec.asp
Recommended pages to watch are SPKISS, MTRainbow, and Chat.
For astro stuff, add SPSunMoonMer, Wheel, and Chaos Clinic.
Chaos clinic comments appear at the bottom of the SPKISS, MTRainbow,
and ChaosClinic pages. Comments in the chat room are announced by a
"duck call" noise. This noise also occurs when the sofware detects a
resonant hex pattern on the Wheel page. Trading tutorials
are on the righty side of the ListOfCharts page. One should
read Trading the MoonTide Tutorial and Keep it Simple as a minimum.
9:00 Good morning from Chaos Manor
9:00 Eastern-System: No comments