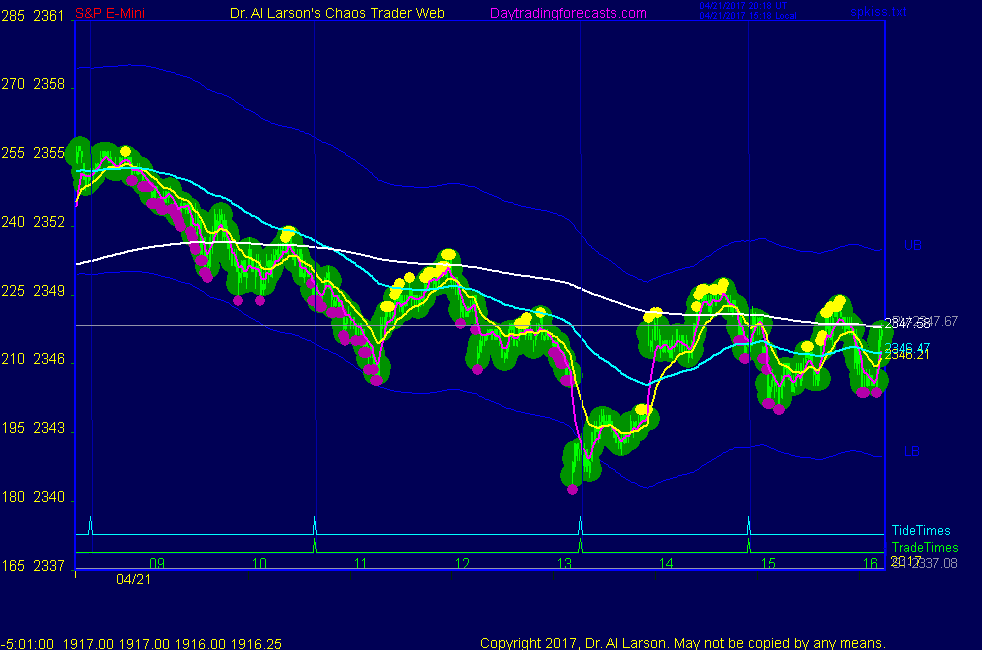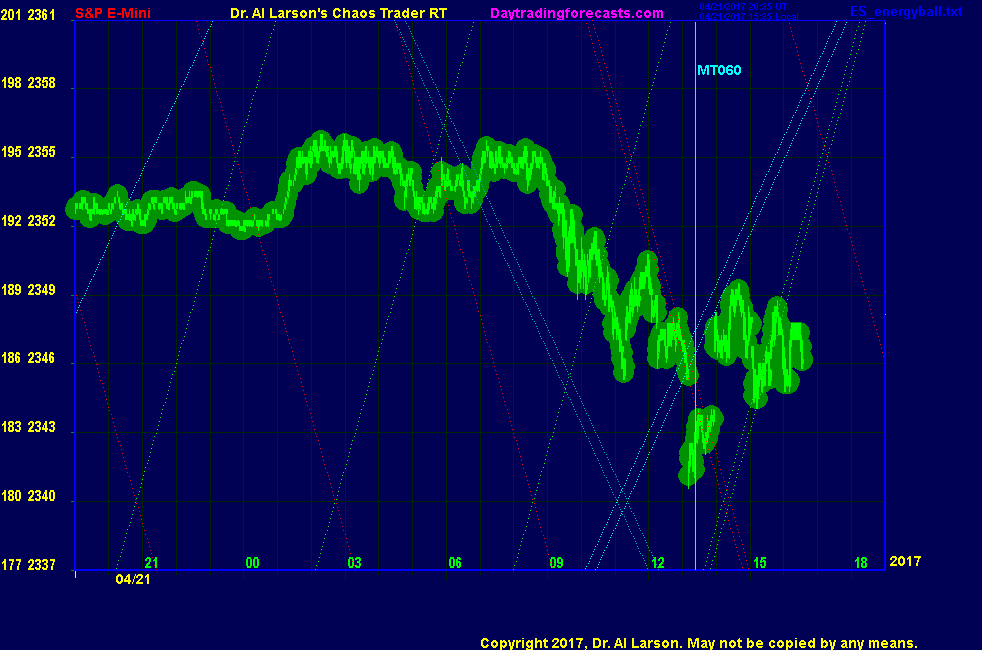


3:21 I'm done-thanks for coming -see you next week
3:20 aborting -2 ; no juice
3:17 stop did not fie-still long
3:10 down to the green swan
3:07 still in by a tick
2:40 now that I see that I'm more comfortable being long
2:37 there is a lot of physical activity to keep track of; one of my research charts showed that
Moon and Mercury hit a key aspect on that low-added it to my AUX page
2:27 stop to 2344 , risk 3
2:24 this has been an up week; I think today was just a pullback - have a higher low than yesterday
could retrace all of the dip
2:11 shorter EXMA's have turned up-buying 2347 stop 2343
2:10 my plasma chart shows a rare two gap pattern-a reversal
2:04 may have turned up one more trade time; kept my loss small on last one
1:57 Hm-buying came in hard on a Moon/Mercury cycle
1:49 out -1
1:48 stop to 2345
1:47 I'll cover 2337 if get there-S1
1:35 I've been ignoring the MTRainbow chart which shows the flow is down; I made up
a scenario of just a modest pullback and believed it ; red swan made me let go of that view
1:26 adjusting stop to 2346 -I moved it too soon
1:18 stop to 2344 - break even
1:16 may reach S1 at 2337
1:14 stop 2346
1:10 sold 2344-red swan won
1:06 too soon-aborted -1.25
12:53 I'm just going to buy the pivot-bought 2347.5-stop 2344.5
12:48 MoonTides are a calculation of how the electric fields affect the S&P. No price data is used.
12:48 electric fields are invisible, but they are real.
12:36 Energy Field Trading aims to use knowledge of the earth's electric field to create a trading edge
here my AUX chart is showing me the electric field flux lines that are in play
12:33 trading is often like watching paint dry
12:27 holding up so far
12:18 testing low - potential double bottom - down energy from Red Swan
12:10 I have placed a Face Of God chart in the Certified Chaos Trader's Room. That room is open
to graduates of my 4 main courses. See http://moneytide.com -> Courses for details.
eMylar Fractal of Pi overlays help you be patient, since they show you future potential moves.
The best bargain in my courses is to take the Cash In On Chaos and Fractal of Pi courses and
learn to use the FOP overlay. Then take Chaos Trading Made Easy, and finish with Face Of God.
11:48 on my AUX page chart I see a blue swan and green swan up later in the day
so I think we hold up or rally from here
11:42 the nest trade time is 13:16, just after solar Noon; today had early T000 Moon timeline,
and late in day have T090 timeline; a "two moon day"; pattern Moon to Moon or Moon, Noon, Moon
Today looks like Moon, Noon, Moon
11:38 3 point quantum range is 9 points; pretty narrow
11:36 made it down to the pivot, got below it, but regained it
11:28 retraced 50% of yesterday's 24 hour range which usuall7 attracts buying
11:20 back-looks like got an inversion to -Tide; nothing to do but wait for next trade time
10:53 aborted -1 ; being too aggressive-taking a break
10:44 rebought 2349.5 stop 2347.5
10:42 out -3
10:40 testing 6 day again
10:34 higher minor low
10:27 looking OK - my logic there was "what price do I need to buy so as not to risk more than 3 points?"
10:21 elected long 2351.5, stop 2348.5
10:17 once the computers reverse, prices will pop so I can't wait to see it, then enter
I'm using a Face Of God course technique here
10:12 my aggressive self says put a buy stop at 2351.5 protect at 2348.5
10:09 tested 6 day mean again
10:06 tracking +Tide amazingly well
10:00 on the AUX chart, the low has a wick outside the plasma channel-that shows a sharp change in energy flow
9:54 down to the 6 day EXMA - but not yet the pivot
9:54 new lows
9:53 still probing
9:46 yesterday the computers managed to sell prices down to the pivot; today they did not get it down to the pivot
9:40 just watching-looks like the common Friday open head fake
9:37 probing for a low
9:30 there is also support on the Moon +T225 electric field flux line; just hit
9:27 the pivot price is 2347.67 - it should be support
9:20 yesterday was an up trust day; today is so far a congestion; I'm looking to trade another up thrust
prices need to take out today's 24 hour highs to get me interested
9:15 yesterday right after the normal session open there was a lot of to-ing and fro-ing; watch for it today
but don't be faked into it
9:12 I'm showing the chart I' using on the AUX page. It shows prices tracking the +Tide
9:05 today's market is very quite, holding most of yesterday's gains; need more volatility for good
day trades; Trade times are 10:40 13:16 and 14:55; bias is up
9:00
9:00 Good Morning. Welcome to the Chaos Clinic. This site has a lot of charts,
so you may find it useful to have several of them available within your
browser. If you have a tabbed browser, you can open separate charts
in separate tabs by right clicking on any link, and selecting "open in new tab"
from the menu. The main list of site pages is at
http://daytradingforecasts.com/chartlistsec.asp
Recommended pages to watch are SPKISS, MTRainbow, and Chat.
For astro stuff, add SPSunMoonMer, Wheel, and Chaos Clinic.
Chaos clinic comments appear at the bottom of the SPKISS, MTRainbow,
and ChaosClinic pages. Comments in the chat room are announced by a
"duck call" noise. This noise also occurs when the sofware detects a
resonant hex pattern on the Wheel page. Trading tutorials
are on the right side of the ListOfCharts page. One should
read Trading the MoonTide Tutorial and Keep it Simple as a minimum.
9:00 Eastern-System: No comments