********************************************************************************
Neptune Vibrations In The S&P
Chaos Clinic for 5/1/2020
********************************************************************************
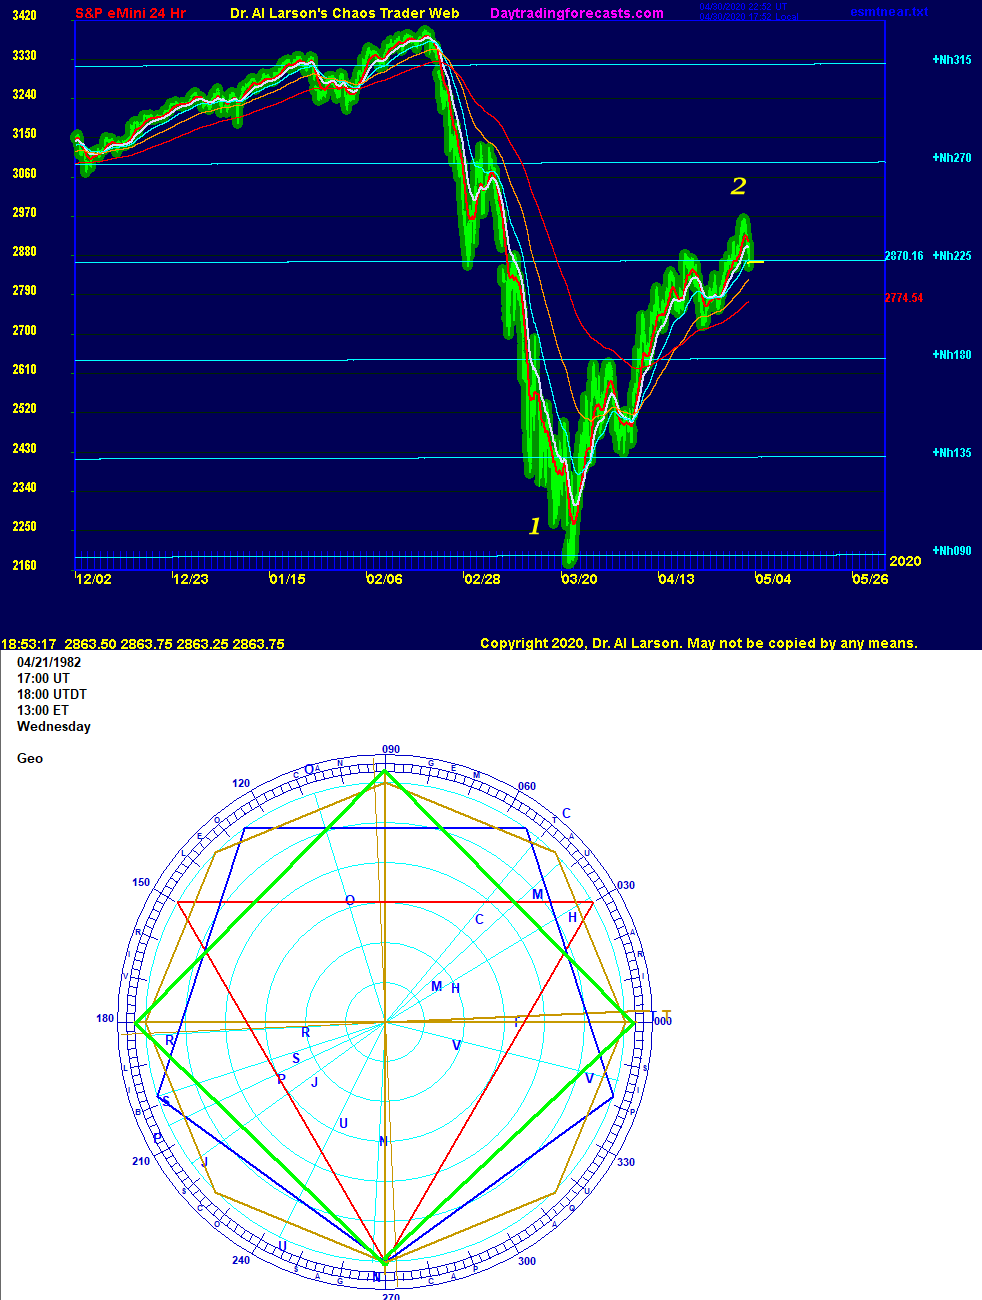
The top chart shows a plasma chart of the S&P, overlayed with heliocentric
Neptune flux lines.
The flux lines are plotted every 45 degrees using a Wheel of 1800 scale.
This scale is 5 times the Wheel of 360 scale that existed before COVID-19.
Markets have a "fractal fuzziness." Underlying that is a harmonic structure
based on integer ratios. This shows up in this chart in the retracement ratios.
The move 2 retracement was .642, a bit beyond the Fibonacci .618.
But in terms of the Neptune levels, the decline was down 5, up 3,
the ratio of two integers, 3 and 5. The Fibonacci series is a seriesof intergers,
starting with 1,2,3,5, and 8. So a a 3:5 ration fits.
Energy adds together in integer ratios.
So why would Neptune electric field flux show up so strongly in the S&P?
The answer is in the second chart, which is a natal ephemeris wheel for the
S&P.
Neptune is very near the cardinal 270 degree position. Using this as a common
point, there are harmonic relationships with several other natal planets.
Natal Sun is trine natal Neptune (red). Mars and Moon are square to it (green).
Venus, Chiron, and Saturn are pentile to Neptune (blue). And Mercury is octile
to Neptune. This octile creates frequency doubling with the square. Frequency
doubling is a precursor to Chaos.
On the top chart, the Nh+315 level is 180 degrees to natal Mercury.The low of
Nh+090 is natal Moon. The current Nh+225 is Mh+090. The intermediate level of
Nh+135 is Mh+000, while the Nh+180 is both Tn+090 and Rn+270. So with the help
of the plasma chart, which helps show the "fractal fuzz" and the ephemeris,
the harmonic structure underlying the chaos is revealed.
The top chart looes like moves 1 and 2 of 7 in a down Chaos Clamshell.
Chaos Clamshells are taught in my Cash in On Chaos course.
A free online mini course called Trading The Chaos Clamshell
can be found at
http://moneytide.com/hans/institute.asp<\a>
For more on my work, see Moneytide.com

5/1/2020 1:13:58 PM MT Al****:: +12 and done for the day - thanks for coming -take some courses-se you next week-stay safe
5/1/2020 1:11:20 PM MT Al****:: minor rally stopped by the 220 - stop to 2826
5/1/2020 12:52:05 PM MT Al****:: patience is a virtue - one I'm still working on
5/1/2020 12:27:04 PM MT Al****:: thanks qq - that means Monday could be volatile
5/1/2020 12:21:39 PM MT qq:: In Daniel chart there's a star burst for Monday PM
5/1/2020 12:20:39 PM MT Al****:: when it gets this dull (jbs called for it) one can look at the XTide at the bottom of the Chaos Clinic chart for clues
5/1/2020 12:11:09 PM MT Al****:: Guided Imagery is the secret to success, popularized by the book and CD "The Secret"
but it has been around a long time. I first heard it form Lou Tice.
What you picture in your mind is what you get.
5/1/2020 12:08:30 PM MT Al****:: Meanwhile, if you want copies of my Burn Virus Burn videos you can
download them from
http://moneytide.com/download/BurnVirusBurn2.mp4
http://moneytide.com/download/BurnVirusBurn10rep.mp4
5/1/2020 12:02:40 PM MT Al****:: today, because of the slope of the EXMAs I think the let it run will work
5/1/2020 12:00:05 PM MT Al****:: many traders trade multiple contracts, taking a quick gain on a portion, and letting the rest run.
5/1/2020 11:56:07 AM MT Al****:: the let it run approach would lower stop to 2829
5/1/2020 11:52:42 AM MT Al****:: this illustrates a point - when to take profits and when to let it run. jbs is using a very systematic approach to trading the MoonTides. He's added strategy and discipline to what this site offers.
5/1/2020 11:45:04 AM MT Al****:: thanks for that jbs
5/1/2020 11:42:35 AM MT jbs****:: I take trumpet lessons every other Friday. Finished at noon, but not soon enough to justify taking short position. Based on my rules, however, I would have shorted at 10:27 and would now be out of the trade for +20.
5/1/2020 11:30:41 AM MT Al****:: so for day traders this looks like a hold to close trade.
But not everyone is a day trader. Longer term traders should look at a 2 month 24 hour 8 hour bar chart of the SH S&P short Exchange Traded Fund, with 18, 36, and 72 bar EXMAs. It has a descending wedge pattern which looks to have ended. Proceed at your own risk.
5/1/2020 11:22:48 AM MT Al****:: also note that yesterday prices in the afternoon got
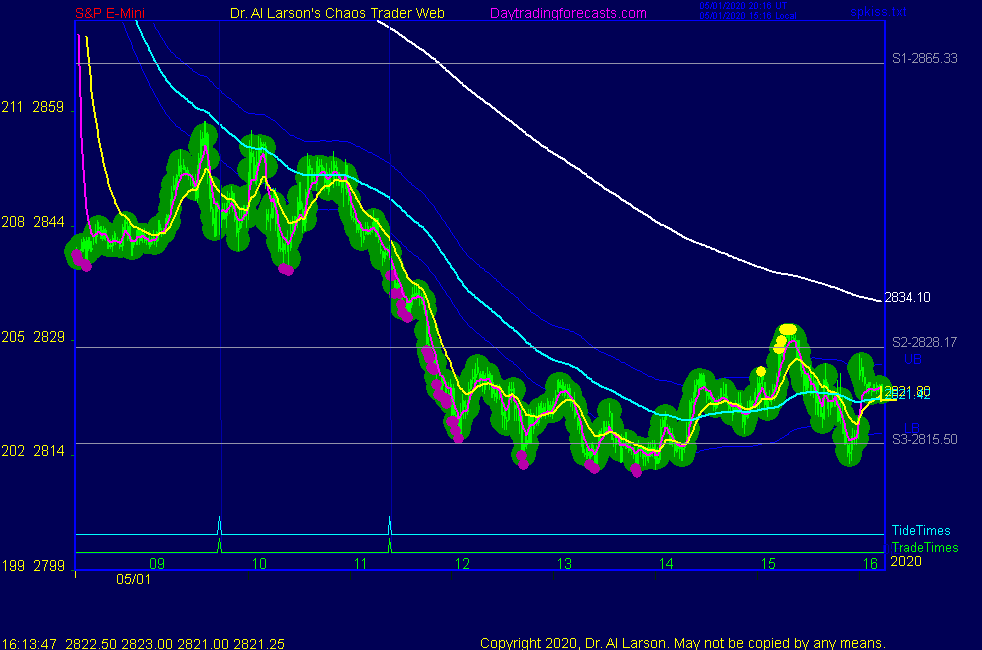
above the gree 220 minute EXMA, but today have come nowhere close to it. That makes it a good stop guide.
5/1/2020 11:19:51 AM MT Al****:: on that 3rd chart on SPKISS page, note that the slope of the white 440 minute EXMA is steeper than yesterday. Also note that yesterday
prices got further above the cyan 110 than today. So today's decline is faster and stronger.
5/1/2020 11:16:44 AM MT Al****:: jbs said he skipped the first MoonTide trade. Had I been here I would have too, for same reason. Then the EXMAs (see 3rd chart on SPKISS page) gave a continuation sell for the second trade. An entry about 2838 was reasonable. A stop now to 2835 at the 220 minute EXAM would lock a tiny profit.
5/1/2020 10:14:16 AM MT Al****:: back from dentist - quite a process under the new rules
last chart on SPKISS page shows that yesterday was a longer term top
5/1/2020 7:39:02 AM MT bew:: Al - tim bost just talked about the saturn 9th harmonic on Larry Pesaventos show
5/1/2020 7:18:33 AM MT jbs****:: Due to the gap down EMAs will be less useful for entry so I will passed on the first trade time. I think market will get dull after 1 pm.
5/1/2020 7:07:39 AM MT jbs****:: Normally after a gap down over night, price will rise until 11am
5/1/2020 6:37:19 AM MT bew:: Thanks for the analysis Al. What does SP chart look like if you plot the heliocentric flux lines of Venus?
5/1/2020 6:24:20 AM MT Al****:: GM all - good luck today
Chaos Clinic is posted on AUX page
I'll be out this AM for a dental appointment
9:00 Eastern-System: No comments