********************************************************************************
FOMC Pump And Dump Tanks the S&P
Chaos Clinic for 5/13/2022
********************************************************************************
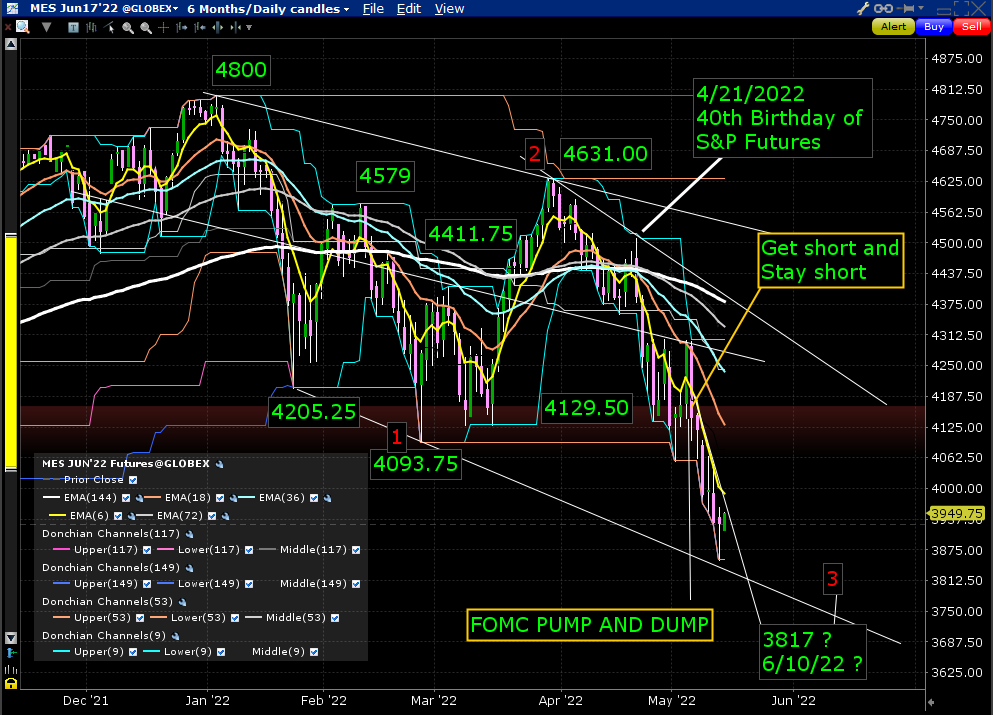
This chart is a daily chart for the S&P MES futures. It is clear that US stocks
have turned down fairly hard. This possibility was suggested in my 4/8/2022
Chaos Clinic , Andrew's Pitchfork In The S&P. At that time,
The S&P was near point 2, 4631.
This chart has a rainbow of EXMAs, and several Donchian channels. The longest
EXMA is 144 days, 2/5 of the circle. It is the thick white line. This is
the Mercury-Venus synodic cycle. It was the basis of W. D. Gann's Square Of 144.
This EXMA helps find the swings in a down Chaos Clamshell,
From the January 3rd high, prices declined for 7 weeks to point 1. During this interval
the 144 EXMA turned down a bit. Then from point 1, the S&P rallied to point 2, turning
the 144 slightly up. The pullback into 4/21 turned the 144 down again, Significantly,
this was the 40th birthday of the S&P. The Mercury-Moon cycle is 40 days, widely
reported by the Bible's astronomer priests. They also used the convention that
"a day is unto a year." Forty years is two 20 year Jupiter-Saturn cycles.
From that point, prices slid sharply to test the levels of point 1. Then prices held up,
awaiting the FOMC meeting. On the 4th, during the FOMC press conference, prices surprisingly soared.
Then the next day they dumped. This FOMC Pump And Dump was due to two Moon transits.
Knowing that these Moon cycles were in play, I commented on the 5th in the daytradingforecasting.com
chat room that this chart, which I posted on the AUX page, suggested a longer term strategy of
"Get short and stay short." So far, that strategy has paid off.
This chart suggests a longer term Chaos Clamshell of 10 or 11 months. This decline could reach
a level as low as 3200.
For more on my work and to subscribe to Tomorrow's Market Email Hotline and access to daytradingforecasts.com see
Moneytide.com
Software to plot electric field flux lines in NinjaTrader is available at
energyfieldtrading.com

5/13/2022 12:05:07 PM MT raf:: Thank you Al for the helpful information, have a good weekend as well.
5/13/2022 11:44:00 AM MT Al****:: rest of day looks flat to down
I'm calling it a day
thanks for coming; see you next week ; have a good weekend
5/13/2022 11:09:03 AM MT Al****:: the move from yesterday/s low to today's high is 180.5 points,
half a circle on a Wheel of 360
5/13/2022 10:58:18 AM MT Al****:: on that chart, note that on the 5th, the FOMC Dump started when
prices broke the higher magenta vibration. These levels are
45 degrees apart. A common 90 degree move goes 2 levels.
5/13/2022 10:53:45 AM MT Al****:: one of the better charts for swing traders is the esNat360 chart on the Secret page
vibration levels are one of my more useful discoveries. The main use of them is in setting stops, targeting , and comparing moves
note that today's rally has stalled ( so far) at the magenta
vibration level. In fact, it barely touched it.
On Wednesday it got above it twice, once before the bad inflation report, the after it.
5/13/2022 10:28:35 AM MT Al****:: another thing I would like to point out are the new Pro1K and
Pro4K pages, which let you watch 12 charts at once
5/13/2022 10:24:17 AM MT Al****:: Fed Chair Powell is being given credit for this rally, but if you not the esnat72 and other charts on the Secret page,
you see 3 vertical lines - Moon transits
so I'm wondering if this is another Pump before a Dump?
5/13/2022 10:21:48 AM MT Al****:: first MoonTide trade was a 20/110 buy with the the 110, 220, and 440 EXMAs up. Rally from yesterday is quite extended, so one
should keep a close stop or take a quick profit
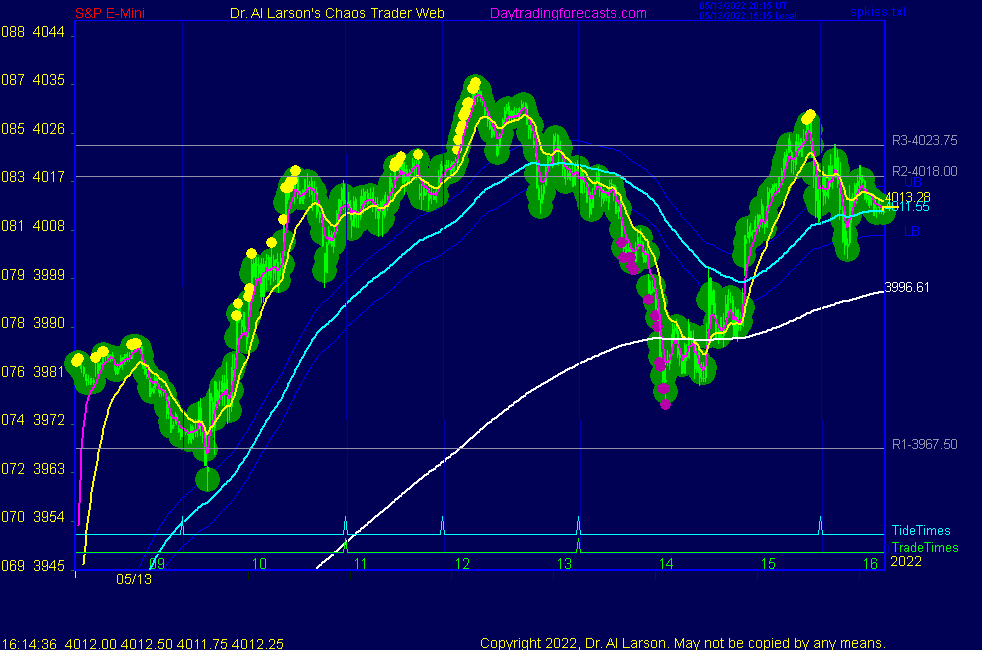
5/13/2022 8:48:11 AM MT Al****:: a couple of notes: On SPKISS page
chart 4 shows Flash Boys bought dip down to R1, then sold R2
chart 6 shows rally up to the 6 day EXMA
also note how clear the FOMC Pump and Dump is on that chart
5/13/2022 7:17:33 AM MT Al****:: Good Morning visitors. Welcome to the Chaos Clinic.
The written Chaos Clinic is on the AUX page.
This site has a lot of charts,
so you may find it useful to have several of them available within your
browser. If you have a tabbed browser, you can open separate charts
in separate tabs by right clicking on any link, and selecting "open in new tab"
from the menu. The main list of site pages is at
http://daytradingforecasts.com/chartlistsec.asp
Recommended pages to watch are SPKISS, MTRainbow, and Chat.
For astro stuff, add SPSunMoon, Wheel, and Chaos Clinic.
A special set of Dr. Al's research charts are on the Secret page.
Comments in the chat room are announced by a
"duck call" noise. This noise also occurs when the software detects a
resonant hex pattern on the Wheel page. MoonTide trading tutorials
are on the right side of the ListOfCharts page. One should
read Trading the MoonTide Tutorial and Keep it Simple as a minimum.
Many subscribers do not strictly trade the MoonTides, but use the charts on this
site as input to their own trading strategies. For example, charts 5 and 6 on the
SPKiss page are a good starting point for swing traders.
Also on this site is the Certified Chaos Trader's Room. That room is open
to graduates of my 4 main courses. See http://moneytide.com -> Courses for details.
9:00 Eastern-System: No comments