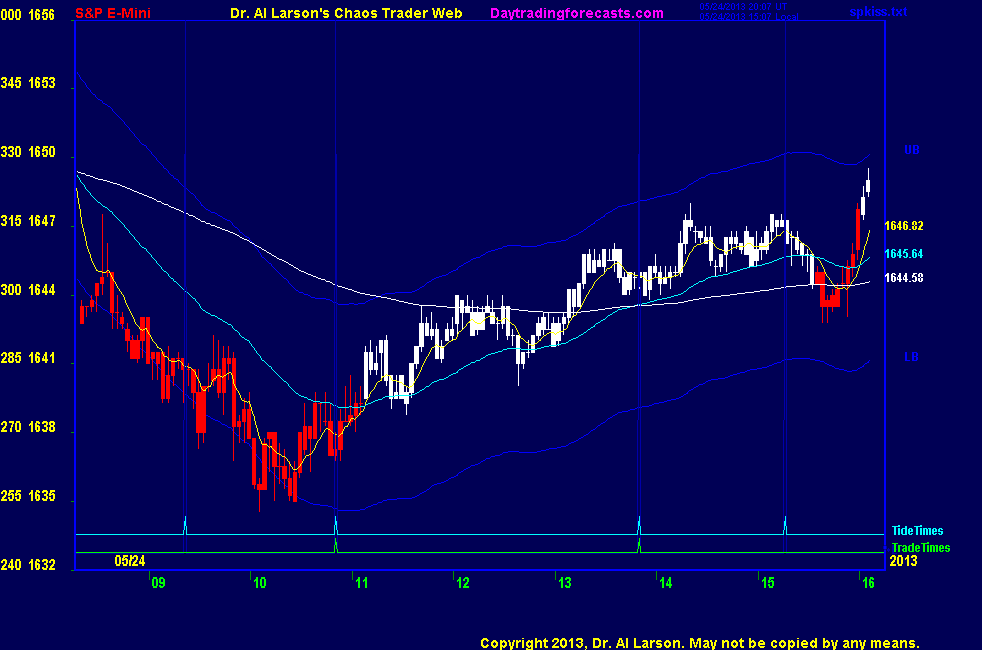


OK, I'm done for the day-thanks for coming-see you next week-take a course-have a great weekend
aborted for -1 -not going
13:05 passing solar noon-Moon/Sun/Node make up an eclipse
12:54 stuck in the mud beween the 110 and 440
12:37 sold 1641.5 stop 1644.5 -missed my fancy sell limit; this trade came early like the first one
My FOG pattern helped me see that
12:35 getting hex pattern "duck call" See Hex Wheels Today and Hex Wheel
tutorial linked on right side of ListOfCharts
12:32 still no fill, lowering sell limit to 1643.50
12:23 no fill on my limit order yet-coming to the Moon T180 timeline
12:16 just for fun, putting a sell limit at 1644 and a buy stop at 1645
12:08 posted a Face of God chart in the CCT Room
12:04 I think the rally will be limited to the Moon -T180 electric field flux line
see SPSunMoonMer chart
11:53 tomorrow is an eclipse-near an eclipse often get "Buzz" - people become unsetttled
for eclipse info see http://eclipse.gsfc.nasa.gov/OH/OH2013.html#LE2013May25N
Also check out my research report on Trading The Eclipses at
https://secure.moneytide.com/secure/moneytide/products.asp
11:42 lost Internet for a bit -technocrap rules
11:26 I have placed a Face of God chart in the Certified Chaos Trader's Room. That room is open
to graduates of my 4 main courses. See http://moneytide.com -> Courses for details.
eMylar Fractal of Pi overlays help you be patient, since they show you future potential moves.
The best bargain in my courses is to take the Cash In On Chaos and Fractal of Pi courses and
learn to use the FOP overlay. Then take Chaos Trading Made Easy, and finish with Face Of God.
11:23 out for 0
11:18 stop to 1640, under 20 EXMA
11:10 will cover 1643; 440 EXMA is at 1644
11:07 still in trade window, bought 1640, stop 1637
11:06 tested yesterday's low, which hel. So rest of day looks to be flat to u9
11:04 back-see stop was hit
10:49 stop held-taking a breakfast break
10:33 looks like I could have waited - stop is in a good place
10:24 the reason for this is one of my research charts which I'm now showing on the AUX page
it shows my Black Swan cycle
10:18 given the volatility, I will let this run and use the 110 EXMA as my stop guide
10:05 stop 1640 ; fast markets tend to shift the times so trade came early
10:01 caved and sold 1637.5 stop 1642 for now
9:58 not yet in the trade window
9:55 marginal new low -still just watching
9:50 3 to 4 points of "Buzz" so far - just watching
9:45 not a lot of action either way
9:37 trying to rally -range today could be about 9 points
9:21 technically this is a gap down day, which often rallies into 11:00. So maybe the first trade time will give a decent trade.
9:16 on the MTRAinbow chart the trend is down -white 440 minute EXMA and 110 are both down
9:08 Today's trades are at 10:51 and 13:50 . The second may be a pass if volatility is low due to the holiday weekend.
9:00 Good Morning. Welcome to the Chaos Clinic. This site has a lot of charts,
so you may find it useful to have several of them available within your
browser. If you have a tabbed browser, you can open separate charts
in separate tabs by right clicking on any link, and selecting "open in new tab"
from the menu. The main list of site pages is at
http://daytradingforecasts.com/chartlistsec.asp
Recommended pages to watch are SPKISS, MTRainbow, and Chat.
For astro stuff, add SPSunMoonMer, Wheel, and Chaos Clinic.
Chaos clinic comments appear at the bottom of the SPKISS, MTRainbow,
and ChaosClinic pages. Comments in the chat room are announced by a
"duck call" noise. This noise also occurs when the sofware detects a
resonant hex pattern on the Wheel page. Trading tutorials
are on the right side of the ListOfCharts page. One should
read Trading the MoonTide Tutorial and Keep it Simple as a minimum.
9:00 Eastern-System: No comments