
Chaos Clinic Recap
Here are Al's comments
*******************************************************************
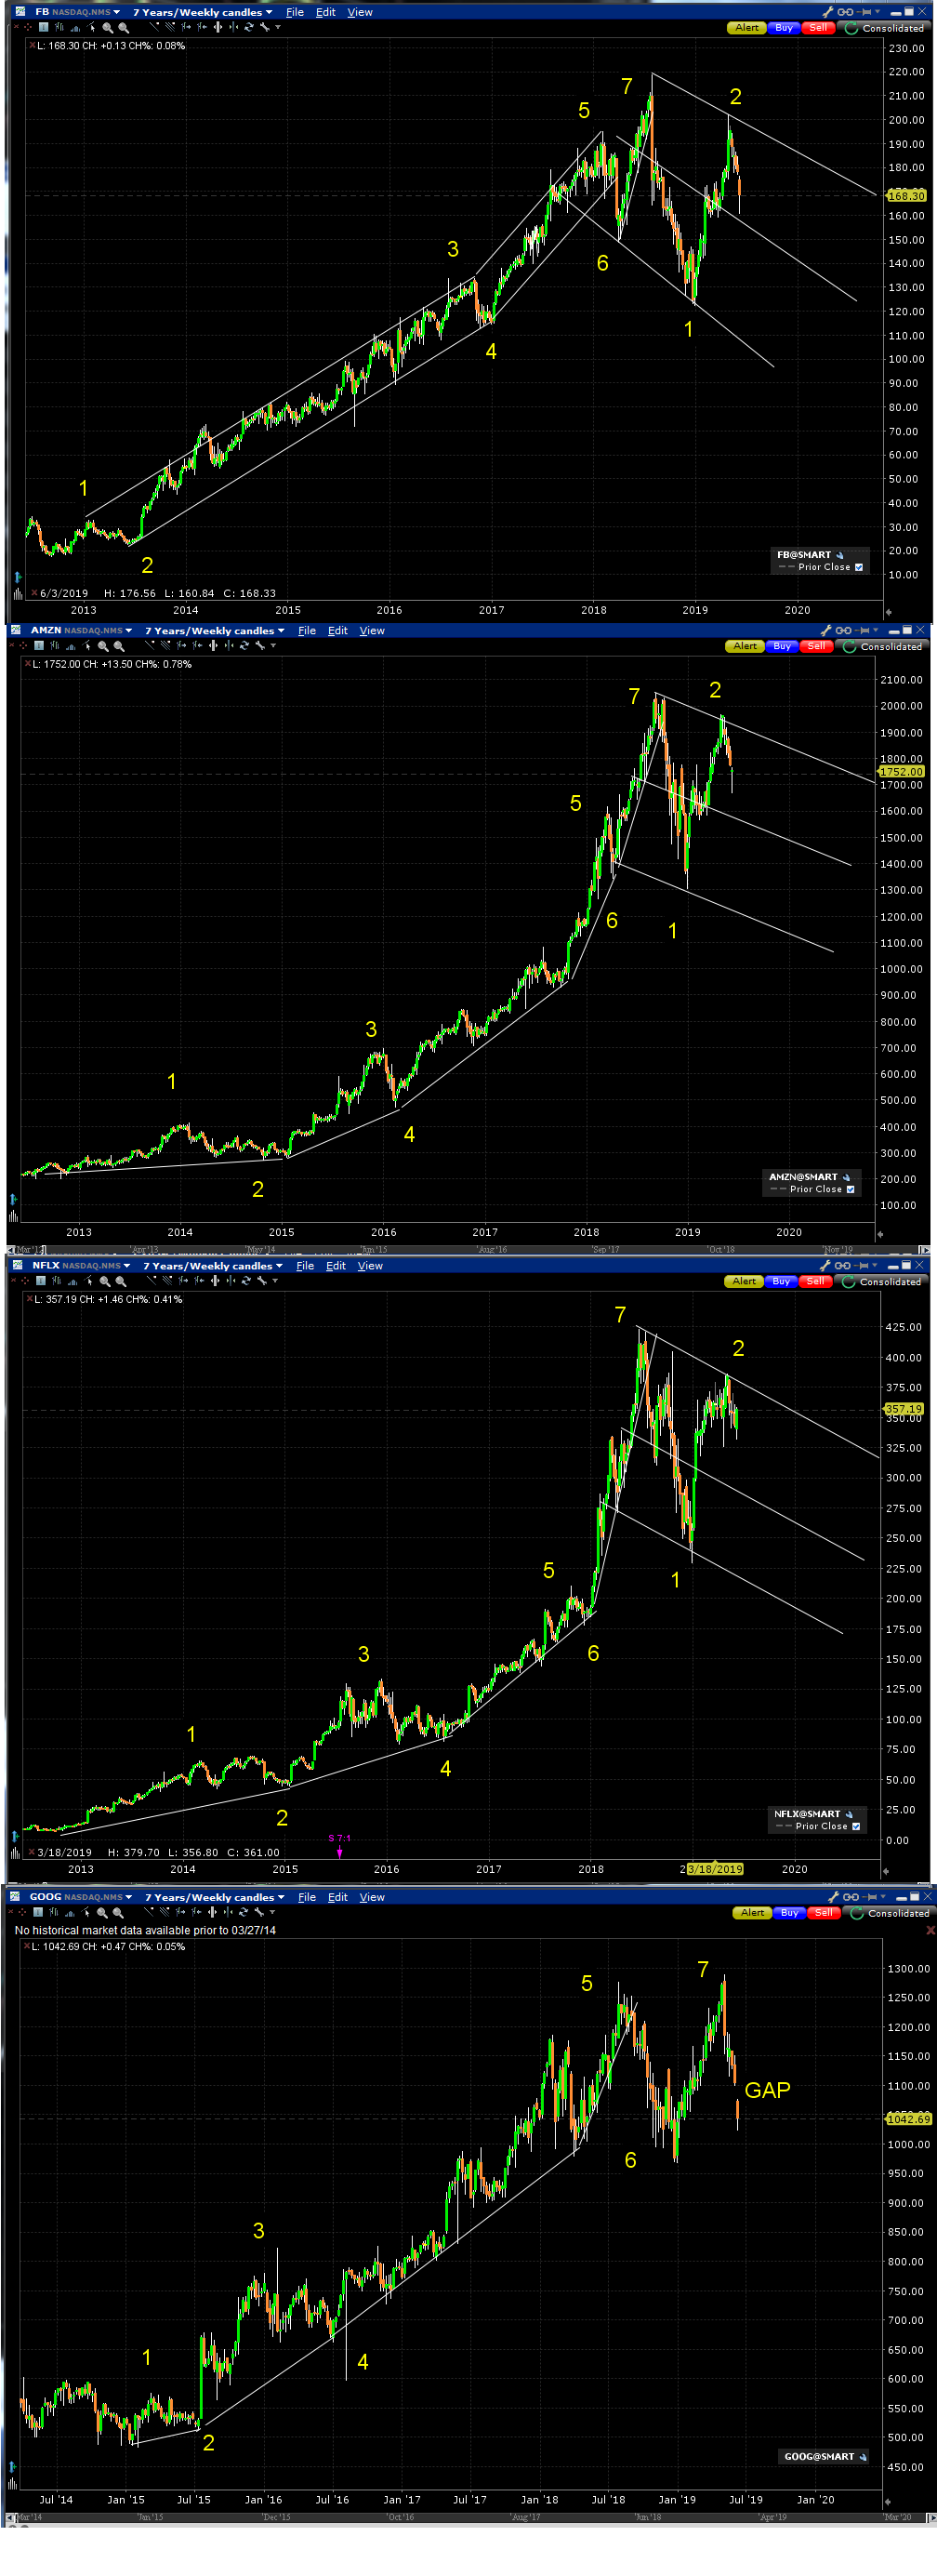
The FANG Stocks Confirm A Bear Market
Chaos Clinic for June 7, 2019
*******************************************************************
The darlings of the bull market of the last decade have been the FANG stocks: Facebook, Amazon,
Netflix, and Google. This four part chart of these four stocks show that three of the FANG stock peaked in
2018, and the fourth, Google, has peaked this year.
The Facebook, Amazon, and Netflix charts look nearly identical. Each shows a 7 move up
Chaos Clamshell, followed by two of a possible 7 moves of a down Chaos Clamshell.
Google is the only one of the FANG stocks to make a higher high in 2019. That apparent
strength was negated by the gap down on the weekly chart.
This strongly suggests that the US stock market is in a bear market. Typically,
since WWII, US bear markets have lasted an average of 14 months. The longest
was 61 months. The pattern on the FANG charts suggest this one will probably run
into the spring of 2021. Typical bear markets have declined about 33%, with the longest
declining over 60%. During these periods, investors should consider moving into
cash ( "Cash Is King") or gold.
To learn more about Chaos Clamshells, I suggest my Cash In On Chaos course,
available at Moneytide.com
Besides the comments made by Al, the chat room has live
comments from other traders who sometimes share their views,
trades and tips. Below are the chat room comments from this clinic
6/7/2019 1:56:46 PM MT ff:: With both $VIX and S&P up today, something has to give - you can't have both.
6/7/2019 1:52:32 PM MT ff:: It seems to be breaking down from narrow price range.
As Dr, Al says The big boys have long ago called it a day and gone off to the Hamptons
6/7/2019 1:40:15 PM MT ff:: Very narrow price moves within converging flux lines seen top Chaos chart and in Daniel chart.
6/7/2019 1:31:51 PM MT ff:: It might or not follow the XTides2Plus green tide till close.
6/7/2019 1:27:15 PM MT ff:: The turquise and magenta moving down. However, I see that's changed and price now moving up again. My short is for over the weekend and not for today.
6/7/2019 1:27:13 PM MT ff:: The turquise and magenta moving down. However, I see that's changed and price now moving up again. My short is for over the weekend and not for today.
6/7/2019 1:14:32 PM MT ska:: MOVING AVERAGES R 21 AND 110 OR 6 AND 36 ???
6/7/2019 1:12:14 PM MT ff:: MT Rainbow also shows confirmation of short.
6/7/2019 1:11:18 PM MT ff:: S&P Bias shows short since 13:00
6/7/2019 1:02:57 PM MT ff:: Went short a while ago. I see the price bouncing off the 5 min VWAP (Volume Weight Aver Price) line
6/7/2019 12:52:12 PM MT Al****:: cyan is 110
6/7/2019 12:50:03 PM MT bew:: Is is breaking?
6/7/2019 12:25:44 PM MT bew:: on this chart http://daytradingforecasts.com/spccsec.asp
Is the white line the 110 or the blue line?
6/7/2019 12:16:40 PM MT mj:: I said in last weeks Friday clinic that we are following 1929 stock market very closely. My research suggests a pull back on Monday lasting about 5 days
6/7/2019 12:16:02 PM MT ff:: One other: Since market surge up the TRIN has also surged higher. Currently it's 1.25. TRIN is a short-term trading tool that measures volatility in the stock market. TRIN represents the relationship between advancing and declining issues by measuring their volume flow. A rising TRIN depicts a weak market and a falling TRIN depicts a strong market. A moving average can be added to smooth the data.
The TRIN was low yesterday indicating market strength.
6/7/2019 12:10:24 PM MT ff:: Also from MMA Stock Market Report it indicates Lunar Cycles
June 11-12 119.5* more often a low
6/7/2019 12:07:06 PM MT ff:: As Dr Al said I see possibility of profit taking. Several red flags.
1) Mexico Tarriffs start Monday
2) RSP:SPY Equal Wt SPY to SPY declining since 6-5
3) IEF:TLT 10 Yr to 20 yr Bond declining since 6-5
4)IYT:XLI Transports to Industrials down since 6-5
5) We've been following XGO which suggests sell off soon
6) XTides Plus indicate down Monday
6/7/2019 11:45:30 AM MT Al****:: Think I'm done for the day; thanks for coming; take some courses
may get some late profit taking selling after such a week.
6/7/2019 11:10:52 AM MT Al****:: I have placed a Face Of God chart in the Certified Chaos Trader's Room. That room is open
to graduates of my 4 main courses. See http://moneytide.com -> Courses for details.
eMylar Fractal of Pi overlays help you be patient, since they show you future potential moves.
The best bargain in my courses is to take the Cash In On Chaos and Fractal of Pi courses and
learn to use the FOP overlay. Then take Chaos Trading Made Easy, and finish with Face Of God.
6/7/2019 10:54:30 AM MT Al****:: looks like the Flash Boys quit at 11:00 and headed for the Hamptons
6/7/2019 10:21:38 AM MT ff:: I also note the same phenomena on the Daniel chart. It seems that often the price movement expands as the flux lines expand and narrows as the flux lines converge.
6/7/2019 10:20:54 AM MT Al****:: yes
6/7/2019 10:17:47 AM MT ff:: Dr Al Re SPSunMoon page it seems to me the flux lines suggest a narrowing of price movement as they converge
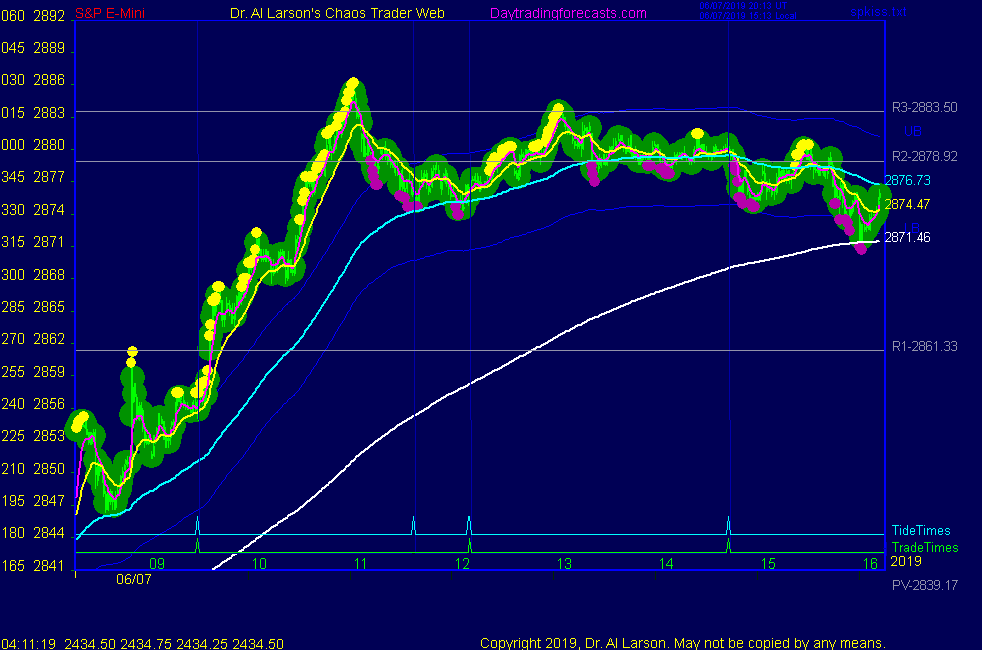
6/7/2019 10:02:25 AM MT Al****:: just watching what the computers are doing
More interesting is looking at SPSunMoon page and noting the flux lines
6/7/2019 9:40:30 AM MT ss:: sell the 2883.50 was a great call
6/7/2019 9:10:21 AM MT Al****:: t5he pivot prices are on the Sp1Day page
6/7/2019 9:06:47 AM MT Al****:: Flash Boys may sell R3 at 2883.5
6/7/2019 8:18:51 AM MT Al****:: Good Morning. Welcome to the Chaos Clinic. This site has a lot of charts,
so you may find it useful to have several of them available within your
browser. If you have a tabbed browser, you can open separate charts
in separate tabs by right clicking on any link, and selecting "open in new tab"
from the menu. The main list of site pages is at
http://daytradingforecasts.com/chartlistsec.asp
Recommended pages to watch are SPKISS, MTRainbow, and Chat.
For astro stuff, add SPSunMoonMer, Wheel, and Chaos Clinic.
Chaos clinic comments appear at the bottom of the SPKISS, MTRainbow,
and ChaosClinic pages. Comments in the chat room are announced by a
"duck call" noise. This noise also occurs when the sofware detects a
resonant hex pattern on the Wheel page. Trading tutorials
are on the right side of the ListOfCharts page. One should
read Trading the MoonTide Tutorial and Keep it Simple as a minimum.
6/7/2019 8:11:56 AM MT ss:: Thanks Al
6/7/2019 8:09:56 AM MT Al****:: those on the SPKISS page
6/7/2019 8:08:06 AM MT ss:: which charts should we be paying closest attn to?
6/7/2019 8:05:44 AM MT Al****:: thanks GON
6/7/2019 7:51:44 AM MT gon:: Hi Al, article published, many thanks!
6/7/2019 7:37:56 AM MT bew:: 9:12 was the trade time for the 9:30 moon tide?
6/7/2019 6:48:02 AM MT jvj****:: Good morning everyone!
6/7/2019 6:42:44 AM MT RR:: GM all
6/7/2019 6:27:53 AM MT ss:: GM
6/7/2019 5:53:10 AM MT Al****:: GM all. Good luck today. Chaos Clinic is posted on the AUX page.
9:00 Eastern-System: No comments


[ Live Clinics on Friday on DaytradingForecasts.com ]