********************************************************************************
The Euro XTide2Plus
Chaos Clinic for 6/9/2023
********************************************************************************
This chart of the Euro 6E futures is from daytradingforecasts.com. It is linked
on the left side of the ListOfCharts page as [ Euro Charts ].
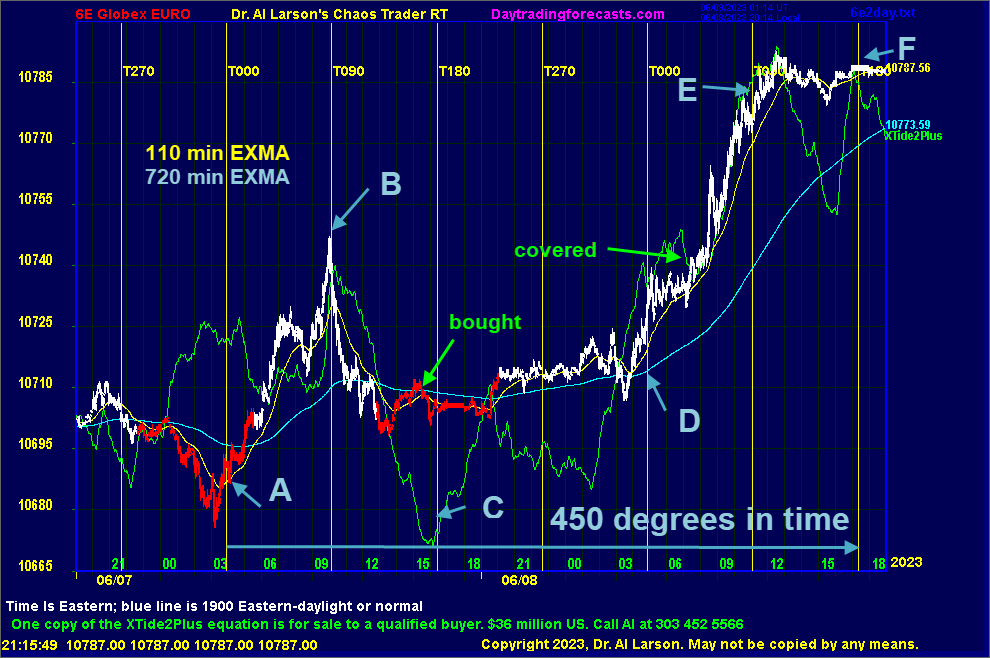
This chart shows a good overnight swing trade starting late in the day of 6/7/2023
running into 6/8/2023. On this chart the red and white line is the 6E 3 minute
bars, colored by 110/720 minute EXMAs. The 720 is plotted as a cyan line, and the 110
is plotted in yellow.
The vertical lines are the exchange aspects to the Moon.
For example, the T000 line is where the exchange is rotated to align
with the Moon. The 6E has a strong tendency to turn on these time lines.
The green line is the computed XTide2Plus forecast. While it is not a perfect
forecast, it is useful when the EXMAs are moving with it.
During the day on 6/7 I noted that the 6E made a low on T000, point A. Then it peaked
at point B on the T090. At point C, the XTide2Plus marked a low at C, From there,
the forecast was up overnight, into point E at T090, with another top on the T180 time
late on 6/8/2023 at point F.
I saw this as a good overnight setup, so I bought 10712 on an overnight swing trade.
The morning of the 8th I covered at 10740, before switching my attention to
daytrading the S&P. I also had to leave for several hours.
A more proper trade would have noted the change in slope of the 720 at point D.
and holding to point E or F. Note that this move from A to F was 450 degrees in
time by the Moon timelines. This 3/2 of a circle is the 3:2 ration of the G note to the C note in music.
In fact the entire musical scale can be build using just the numbers 2 and 3.
For more on my work and to subscribe to Tomorrow's Market Email Hotline and access to daytradingforecasts.com see
Moneytide.com
Software to plot electric field flux lines in NinjaTrader is available at
energyfieldtrading.com

6/9/2023 12:34:18 PM MT Al****:: I'm done for the day - thanks for coming -see you next week-take some courses
6/9/2023 12:33:15 PM MT Al****:: also R1
6/9/2023 12:32:47 PM MT Al****:: did not like resistance here at +Vh135
6/9/2023 12:32:07 PM MT day:: nice trade.
6/9/2023 12:31:41 PM MT day:: if we r following the red tide could turn down soon, but the bias tracker just went positive . Is that what u meant by juice? or just an exaggerated move, Ty
6/9/2023 12:31:33 PM MT Al****:: covered for +10
6/9/2023 12:23:46 PM MT Al****:: I like the juice here
6/9/2023 12:20:47 PM MT Al****:: stop to 4304.5 , below the 440
6/9/2023 12:00:43 PM MT day:: Thanks
6/9/2023 11:57:25 AM MT Al****:: I try not to set my mind to EXPECT something. I just try to
figure out what the market IS doing, and what it COULD do,
and try to go with it while protecting myself
6/9/2023 11:52:18 AM MT Al****:: the 36 min EXMA turned up on the +Mh000 flux line
not sure I "expect" a new high, but it is a possibility with the
+Mh045 near 4345
6/9/2023 11:47:30 AM MT Al****:: 36/220 has now colored bars as up on several charts-stop to 4303
6/9/2023 11:45:40 AM MT day:: would u expect a new high today? Ty
6/9/2023 11:33:03 AM MT Al****:: stop 4301.5 under last low
6/9/2023 11:29:56 AM MT Al****:: stop to 4300 - break even
6/9/2023 11:16:29 AM MT Al****:: stop 4298.5
6/9/2023 11:10:06 AM MT day:: Thanks
6/9/2023 11:09:05 AM MT Al****:: stop to 4297
6/9/2023 11:07:51 AM MT Al****:: flow is a pretty lose term-the EXMAs will show eventually
but the isolated push ball, no lower push ball, and 7 moves down looked like a good setup to buy
6/9/2023 11:01:48 AM MT Al****:: long from 4299.75 stop 4293.75
6/9/2023 10:58:02 AM MT day:: question now is the flow up or down now? we filled the morning gap which shows weakness?
6/9/2023 10:50:27 AM MT Al****:: on confusion days a good technique is to go with the flow after the third vertical line
6/9/2023 10:33:24 AM MT Al****:: coming to third vertical line on secret charts
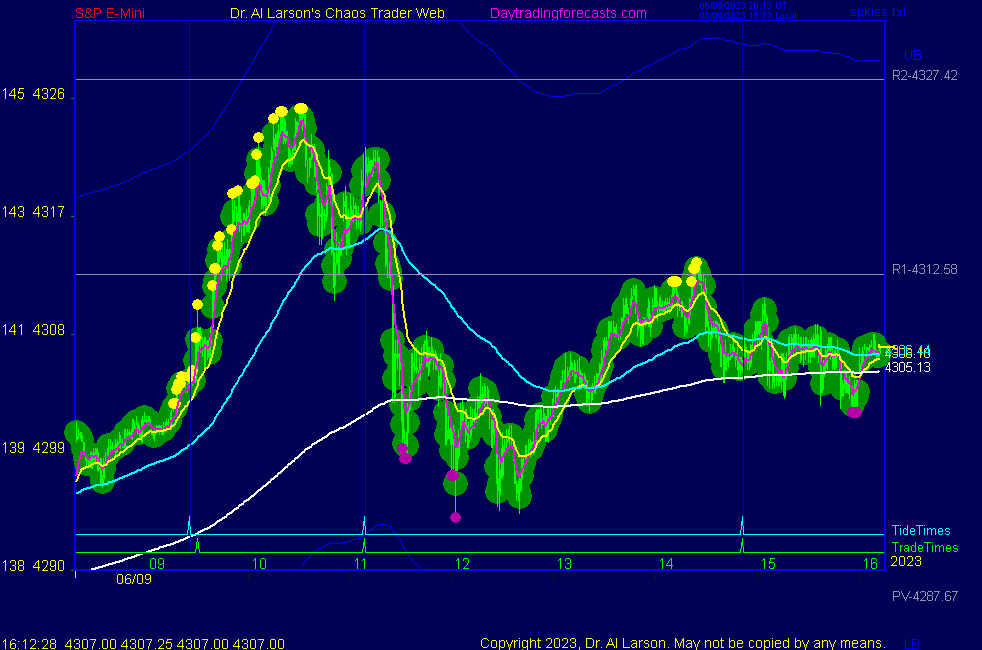
6/9/2023 10:30:38 AM MT Al****:: 7 moves down from high
6/9/2023 10:27:29 AM MT Al****:: if there are no more pushballs after 27 minutes it is a good sign of a change in daily trend
6/9/2023 10:12:56 AM MT Al****:: on chart 4 on SPKISS page note the push balls-the last one on the low is a "isolated push ball" which means selling changed to buying very rapidly -a hallmark of computerized trading
6/9/2023 10:09:27 AM MT Al****:: dipped to -Mh045 flux, then up through +Mh000
6/9/2023 10:05:40 AM MT Al****:: this low is on the Moon T090 timeline
6/9/2023 9:56:59 AM MT Al****:: the secondary high was right on the second trade time, but would not have suggested selling with the 440, 220, and 110 up
but they did suggest pressing the stop, which I did
6/9/2023 9:54:14 AM MT Al****:: a day like this on Friday usually means a sideways movement into the close as big firms hold it up while they liquidate
as a trader, I give thanks for a positive gain.
6/9/2023 9:42:06 AM MT Al****:: the drop found support at the prior close and the +Mh000 flux
the exchange is rotating past Mercury
6/9/2023 9:33:17 AM MT Al****:: on the secret->esnat72 chart note went from white level to yellow
that is a sign of a weak move
6/9/2023 9:29:33 AM MT Al****:: broke that - my MoonTide trade was stopped out for a +6
on the Secret->esnat72 there are 3 vertical lines - white, grey, brown
I call these "confusion lines" because each can change the market direction
so one needs to be cautions going through them
6/9/2023 9:14:41 AM MT Al****:: last pullback low found support on +Vh135
6/9/2023 8:00:50 AM MT Al****:: yesterday's low was on the Venus +Vh090 electric field flux line
just moved above +Vh135-could go to +Vh180 near 4353 , which is R4
6/9/2023 7:44:22 AM MT Al****:: broke highs of week - going higher - R4 possible
6/9/2023 6:45:02 AM MT oag****:: Good morning everyone! Hope everyone has a prosperous day!
6/9/2023 6:37:42 AM MT Al****:: Good Morning visitors. Welcome to the Chaos Clinic.
The written Chaos Clinic is on the AUX page.
This site has a lot of charts,
so you may find it useful to have several of them available within your
browser. If you have a tabbed browser, you can open separate charts
in separate tabs by right clicking on any link, and selecting "open in new tab"
from the menu. The main list of site pages is at
http://daytradingforecasts.com/chartlistsec.asp
Recommended pages to watch are SPKISS, MTRainbow, and Chat.
For astro stuff, add SPSunMoon, Wheel, and Chaos Clinic.
A special set of Dr. Al's research charts are on the Secret page.
Comments in the chat room are announced by a
"duck call" noise. This noise also occurs when the software detects a
resonant hex pattern on the Wheel page. MoonTide trading tutorials
are on the right side of the ListOfCharts page. One should
read Trading the MoonTide Tutorial and Keep it Simple as a minimum.
Many subscribers do not strictly trade the MoonTides, but use the charts on this
site as input to their own trading strategies. For example, charts 5 and 6 on the
SPKiss page are a good starting point for swing traders.
Also on this site is the Certified Chaos Trader's Room. That room is open
to graduates of my 4 main courses. See http://moneytide.com -> Courses for details.
9:00 Eastern-System: No comments