********************************************************************************
TSLA Looking Up
Chaos Clinic for 6/11/2021
written the evening of 6/10/2021
********************************************************************************
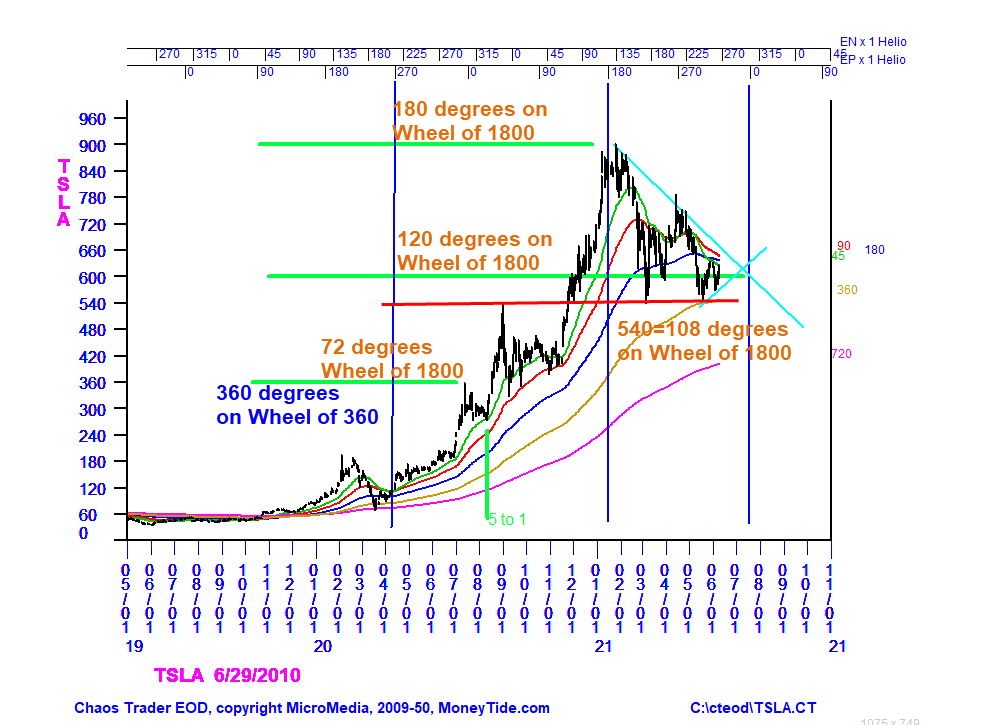
This chart shows TSLA stock since mid 2019.It is a daily chart with
a rainbow of EXMAs. The lengths are 45, 90, 180, 360, and 720 days.
Shown along the top are two astro cycles, Earth-Neptune (EN) and Earth-Pluto(EP).
In April of 2020 TSLA turned up on the 270 degree aspect of EP. Prices got above
all of the EXMAs.In a short 3 months, prices soared to 360, a full circle on
the Wheel of 360 by 12 July 2020.
Prices then sagged into August. Then TSLA announced a 5:1 stock split. I pay special
attention to the number 5. In harmonic work, one sees triangles (3), squares (4),
hexagons (6), and octagons (8). One can tile a two dimensional plane with all of
these shapes. But to tile a surface with a pentagon, one must tip it and form a
three dimensional shape. The soccer ball is the result. So 5 is a "shape changer."
That 5:1 split changed the scale of price and degrees. TSLA was working on a Wheel of 360.
With the split, it jumped to a Wheel of 1800. That meant one had to re-examine the harmonic
levels of TSLA. The full circle high at 360 became a 72 degree point. After the split,
TSLA immediately rallied to 540, or 108 degrees. This is a 3:2 ratio from the prior high,
the "fifth" chord in the musical scale.
Prices then sagged into November, from where it exploded into the January high at 900.
This was the 180 degree aspect on EP, and 180 degrees on the Wheel of 1800. Since then
prices have been forming a converging triangle correction. The 540 price (108 degrees)
has been tested twice. What was resistance is now support. The 5/18 low bounced off of
this level, and off of the 360 day EXMA.
Now prices are vibrating about the 600 (120 degrees) level. They have made a higher high
after the 5/18 low. The cyan lines show a converging triangle, with the apex near the
July EP conjunction.
All this points to TSLA resuming its rally soon. A full circle move would take prices
to 1800. This is not a recommendation to buy or sell. It is simply an analysis. Proceed
at your own risk.
For more on my work and to subscribe to Tomorrow's Market Email Hotline and access to daytradingforecasts.com see
Moneytide.com
Software to plot electric field flux lines in NinjaTrader is available at
energyfieldtrading.com

6/11/2021 1:02:23 PM MT Al****:: I need to call it a day. Thanks for coming. See you next week.
Take some courses.
6/11/2021 12:36:10 PM MT Al****:: still working higher
6/11/2021 12:02:48 PM MT Al****:: price is running up the Moon timeline, fracturing the down Fractal of Pi
6/11/2021 11:48:19 AM MT Al****:: now the rotating Exchange passing the Moon can add energy
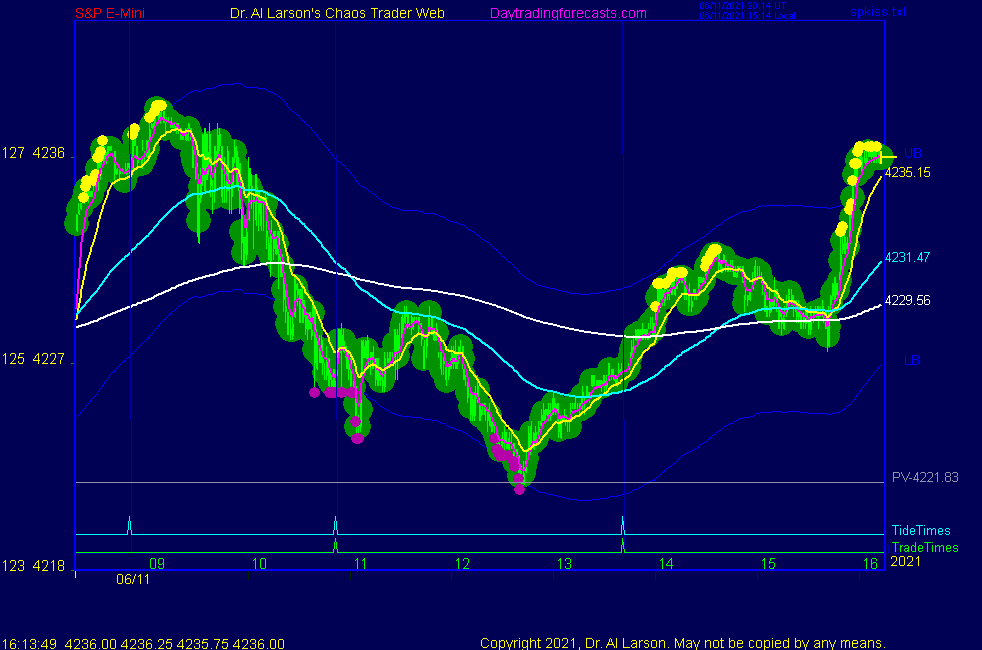
6/11/2021 11:45:22 AM MT Al****:: note the bar colors on the Chaos Clinic chart. Also note the
Xtide plot at the bottom of the chart. It shows a peak in the last hour.
6/11/2021 11:17:41 AM MT Al****:: Fractal of Pi overlays help you be patient, since they show you future potential moves.
The best bargain in my courses is to take the Cash In On Chaos and Fractal of Pi courses and
learn to use the FOP overlay. Then take Chaos Trading Made Easy, and finish with Face Of God.
6/11/2021 11:14:05 AM MT Al****:: I have posted a third chart in the CCT Room. It shows a Fractal Of Pi pattern for today's action
6/11/2021 10:57:29 AM MT Al****:: I have posted a second chart in the CCT Room showing the chart I was watching for that trade - it contains timelines, flux lines, and a Face of God pattern
6/11/2021 10:51:10 AM MT Al****:: the first MoonTide trade could have been taken as a sell about 4231 covering now about 4224
6/11/2021 10:46:14 AM MT Al****:: they did
6/11/2021 10:43:06 AM MT Al****:: decline has now reached the pivot price so Flash Boys may buy
6/11/2021 10:19:16 AM MT Al****:: yesterday the rotating Earth passed the Node,sun, and Moon at 13:00 Eastern, forming a secondary high.
Today the three are separarated. Passing Node now, Sun at 13:00, and Moon about 13:40. Watch for a broad low.
6/11/2021 9:47:11 AM MT Al****:: note flat set by Sun and Mercury flux on SPSunMoon chart
6/11/2021 8:02:20 AM MT Al****:: The S&P dipped into the eclipse yesterday morning, the rallied, so it looks like a low to me
See chart 6 on SPKISS page
I do not study divergences - just study the electric field effects
6/11/2021 7:49:47 AM MT .:: The DOW is not showing strength like the SP500 did. Do you look for divergence like that?
6/11/2021 7:48:46 AM MT .:: Morning Al, are you expecting a sell off today after the solar eclipse?
6/11/2021 7:02:50 AM MT Al****:: I have added a chart to the CCT Room
6/11/2021 6:26:38 AM MT Al****:: Good Morning visitors. Welcome to the Chaos Clinic.
The written Chaos Clinic is on the AUX page.
This site has a lot of charts,
so you may find it useful to have several of them available within your
browser. If you have a tabbed browser, you can open separate charts
in separate tabs by right clicking on any link, and selecting "open in new tab"
from the menu. The main list of site pages is at
http://daytradingforecasts.com/chartlistsec.asp
Recommended pages to watch are SPKISS, MTRainbow, and Chat.
For astro stuff, add SPSunMoon, Wheel, and Chaos Clinic.
A special set of Dr. Al's research charts are on the Secret page.
Comments in the chat room are announced by a
"duck call" noise. This noise also occurs when the sofware detects a
resonant hex pattern on the Wheel page. MoonTide trading tutorials
are on the right side of the ListOfCharts page. One should
read Trading the MoonTide Tutorial and Keep it Simple as a minimum.
Many subcribers do not strictly trade the MoonTides, but use the charts on this
site as input to their own trading strategies. For example, charts 5 and 6 on the
SPKiss page are a good starting point for swing traders.
Also on this site is the Certified Chaos Trader's Room. That room is open
to graduates of my 4 main courses. See http://moneytide.com -> Courses for details.
9:00 Eastern-System: No comments