
Chaos Clinic Recap
Here are Al's comments
3:27 I'm done-thanks for coming-see you next week-take a course-get your eMylar overlays
3:25 looks like we have a larger unfinished fractal - I see 1-2-3-and 4, wtih 5-6-7 to come Monday
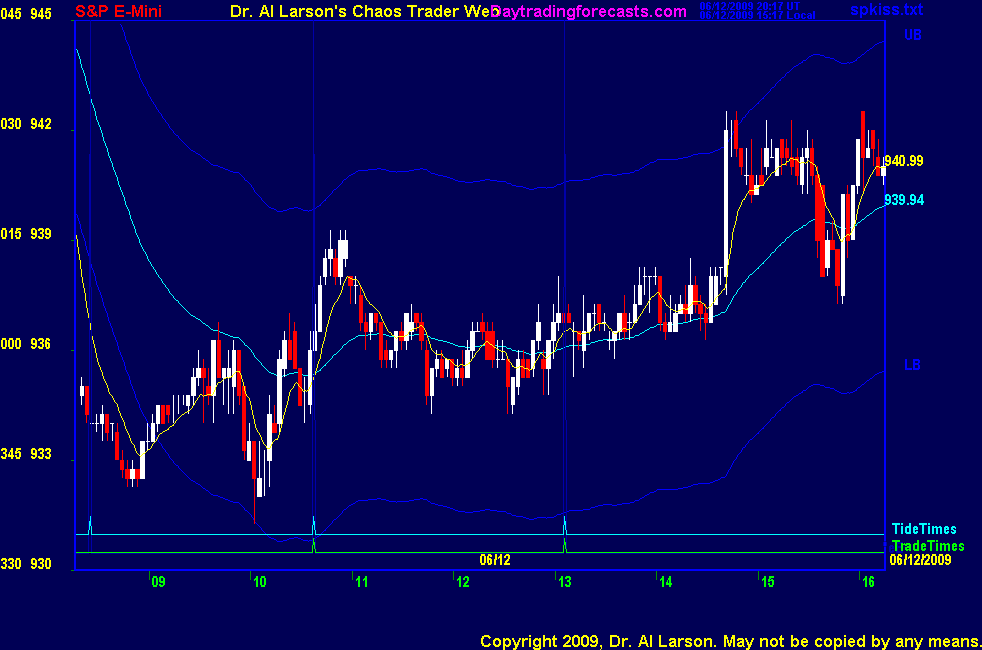
3:11 the MT Rainbow chart looks like the Chinese ying-yang symbol balance about 942
3:00 this popup hit the 50% retrace level
2:52 in the chat room MM points out that the high hit the pit pivot price. May be all there is.
On the wheel of 72, 942.5 is 90 degress to the Moon's Node
2:49 I'm not chasing this move-not in a MoonTide trade window or part of any pattern I was watching
2:42 my down fractal has fractured, so I'm done trading for the day.
2:34 TG asks how today's pattern is like or unlike Monday's. The intraday patterns are similar. Monday gave a late rally.
What is different today is that we are now trading under a double top, and the Moon has moved 60+ degrees
2:30 coming to a critical point in the fractal-still intact
2:23 cancelling my buy stop-don't want to be long
2:20 this is a stock specialist's dream-flat and churning
2:13 by hotline rules we are out of the trade window, so if elected into a trade, it will not be a hotline trade.
The reason I'm watching for a trade is that my Fractal of Pi pattern shows a potentila drop in the last hour
2:06 raising my sell stop to 35.25 and placing a buy stop at 39.75
2:00 I have updated my Face of God chart in the CCT room
1:51 trying to rally-right here I would not go long due to the bigger pattern
1:37 here I'm noting that the last swing high was 938. Should we breakd down, my stop would be 938.5
1:33 the two day range is about 27 points; divide that by 3 says a congestion could last 7 trading hours.
The decline lasted 4.5 hours, so the congestion could end in 4.5 hours; long time to wait for a table :)
1:24 last support was at 934.25; I will place a sell stop at 933.25 to catch any breakdown
1:18 congestions are states of rest in a market system. Prices rest, then make a chaotic move to another state of rest.
Chaos follows dullness. So don't get bored and leave. Be ready for the chaos when it comes.
1:11 I'm seeing that my Fractal of Pi is still good-posted an update in the CCT Rooom
1:08 Elliotte Waver's are now seeing an ABC correction off the low, with each leg a smaller ABC
1:00 This is distribution under a high. When it ends the down move will continue-need to break 934 for bear move
Streak up the Sun timeline
12:50 that trade attempt was before the trade time-still congesting-may get another chance later
12:49 getting hex pattern again-tending to stabilize prices
12:47 out -1; not going
12:33 sold 935 stop 937.5
12:32 looking weak-watching for follow through
12:25 volatily has "pinched" down - often a precursor to a chaotic move
12:23 on the MTRAinbow chart, the 440 EXMA is steadily down - coming into the trade window
12:13 on the Wheel of 72, 936 is 0 degrees, and a balance point- pretty much stuck on it
12:03 on the Chaos Clinic chart, low was on the Node (O) flux, and the high on the Mars (R) flux
and currently trading on the Venus (V) flux; Mars and Venus are conjoining in the night sky-easy to see
11:56 not a lot of juice here - don't think Jude4's trade has that much potential
11:46 getting some selling-Jude 4 TS on AUX page sold
11:32 I have placed a Face of God chart in the CCT Room
11:22 I have placed a Fractal of Pi chart in the Certified Chaos Trader's Romm. It is open to those who have
taken my 4 main courses. For more info on courses, see http://moneytide.com -> courses.
11:13 on the MTRainbow chart, we see a thrust down, followed by a congestion. After the congestion, we should see
another thrust. The congestion should last into the next trade time
10:57 on the Aux page I have displayed one of my autotraders-a work in progress-it is flat, looking to sell
10:47 rallied to close the gap; the 440 should limit it
10:40 out -2;no go
10:31 may get stuck in the mud
10:29 resold 935 stop 938
10:26 this is the ralyy I expected due to the gap down; watching to see if we get a sell setup
10:23 rally enough to turn the 110 weakly up; looks like prices are going flat
10:21 tested yesterday's 9:00 low, broke it marginally, but came back above it
10:15 I may resell if we get a second continuation
10:12 aborting for 0-not moving
10:07 coming to the vertical Moon T+270 timeline-should add some Moon juice
10:05 stop 936
10:01 this entry is before the exact trade time, so I want to be careful near the time
9:59 stop to 937.5
9:56 sold 933.5 stop 939.5
9:51 near term support is at 934; need to break it for a good sell setup
9:50 the 110 EXMA is down, setting up a possible continutation sell on the first trade
9:45 on the MTRainbow chart the white 440 minute EXMA is down, near 941. It should limit any news rally.
The 440 EXMA indicates the day's major direction.
9:40 Consumer Sentiment report is released at 9:55 Eastern today
9:32 hex pattern recognized formed by price, Venus/MArs, Pluto and Moon A vector
9:28 Opening with small gap down-normallyh gives us a rally until about 11:00
Trade times today are 10:38 and 13:06
9:00 Good morning from Chaos Manor
Besides the comments made by Al, the chat room is has live
comments from other traders who sometimes share their views,
trades and tips. Below are the chat room comments from this clinic
6/12/2009 1:39:01 PM MT DBJ****:: I see the 7 moves that you mentioned TG. We will have to wait until Monday now to see how this move pans out, but I have uploaded a pic of the FOP that I saw when I tried to reproduce the one that Al found. It looked like it was going to fracture too, but it hasn't quite yet.
6/12/2009 1:00:43 PM MT TG****:: DBJ, my read is similar re: likely beginning and end of fractals. Monday mornings initial thrust down was toward the end of a down fractal that had been in place nearly all day Friday, the lower low in early afternoon only broke down by 1.5 pts and only .5 pts on a closing 3 minute bar basis, so akin to a double bottom with a minor throwover. Today one could have argued there were 7 moves to this mornings low with 4 distinct pushes lower in about 4 1/2 hours including today's preoutcry session. That's an atypical fractal but feasible and like you said, probably was more likely a move 1 of a bigger down move. But either way, no new low by about 2:30 and shorts get squeezed.
6/12/2009 12:44:37 PM MT mm****:: The pit pushed it to their pivot - 942.50
6/12/2009 12:41:47 PM MT mm****:: Iran has a new president - is that the reason for the jump?
6/12/2009 12:38:14 PM MT DBJ****:: Al may make his own comments as requested, but my take on TG's question is that last Monday, the market gapped down, retraced, then went to a new low. Also, there were 7 clear moves down from the High on the previous Friday. The move today looks more like a short rest before a bigger move down.
6/12/2009 12:24:00 PM MT TG****:: Al, if you get a chance during the clinic, could you say what key things about today's pattern make it disimilar to this past Monday's. Seems like a lot of similarities thus far.
6/12/2009 7:22:16 AM MT Al****:: GM all-good luck today
6/12/2009 7:15:02 AM MT UNI:: GM All
6/12/2009 5:58:00 AM MT mm****:: gm all - have a great day
9:00 Eastern-System: No comments


[ Live Clinics on Friday on DaytradingForecasts.com ]