Chaos Clinic Recap


Here are Al's comments
******************************************************************
S&P Stalls While Gold Sours
Chaos Clinic for 6/14/2019
******************************************************************
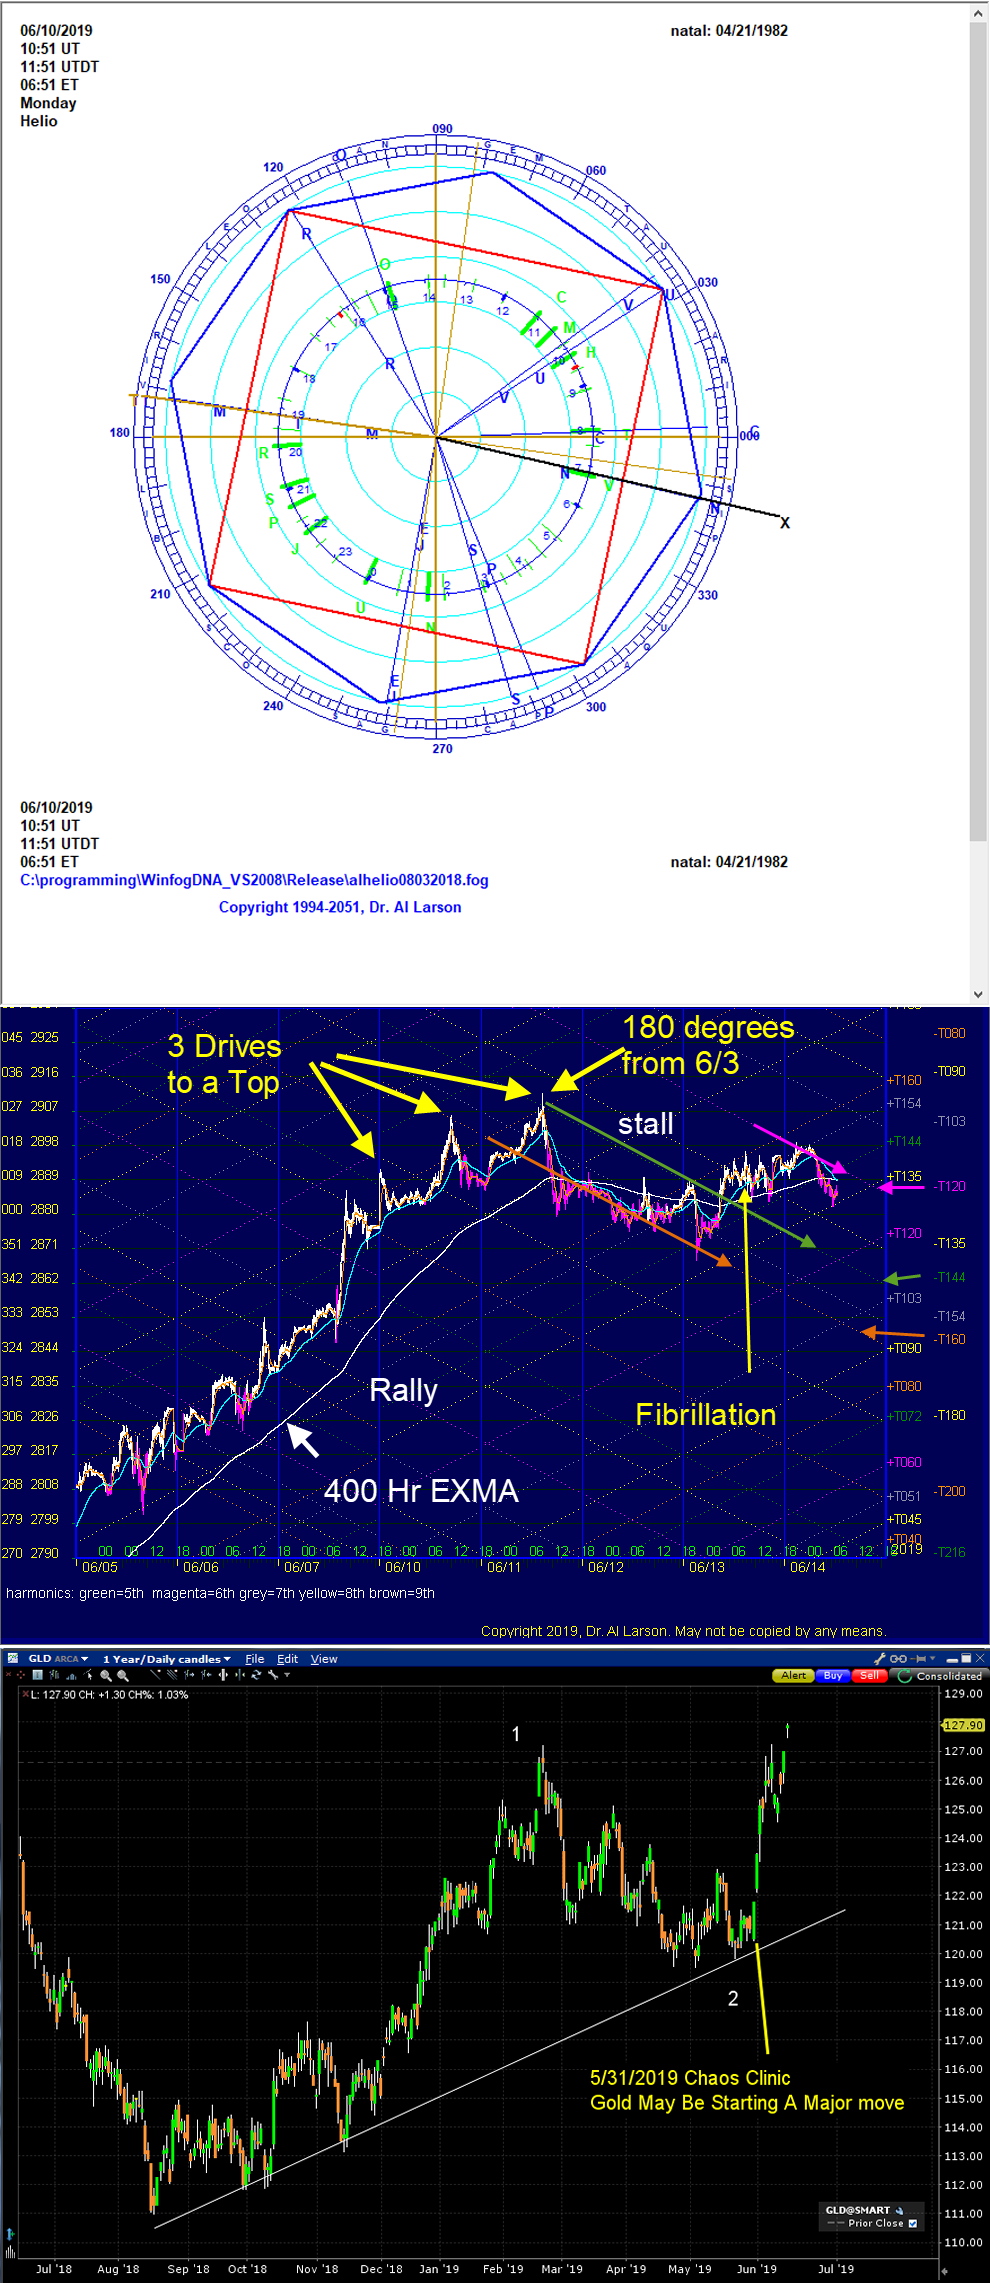
This week's Chaos Clinic has three charts: an ephemeris wheel,
a chart of the S&P, and a chart of GLD, a gold Exchange Traded Fund.
There is a story behind the ephemeris wheel. At 3:30 AM last Saturday
morning, I woke up feeling a tremendous amount of energy. I was surprised,
because I had gone to bed feeling really tired after a long, hard week.
Realizing that I was not going to get back to sleep, and feeling a lot of
physical energy (Mars) I decided to plunge into a much deferred deep cleaning
of my office. This involves wiping down every book, wire, computer, picture,
whatever in my office. I made good progress for many hours. Then it came to
mind (Mercury) that maybe I was sensing something in the heavens. I learned
many years ago that I am "astro sensitive." I think we all are, but I am built
in such a way that I tend to feel energies strongly at times. I've learned that
often these same energies show up in the S&P two or three days later.
So I looked at my ephemeris, and discovered I was picking up the forming Earth/Jupiter
and Venus/Uranus helio conjunctions. Twelve Earth/Jupiter periods has shown up as
my 13 year Air Force and 13 year Bell Labs careers. The Venus/Uranus conjunction
was smack on my natal Mars ( that physical energy ) while current Mars was squaring it.
No wonder I was charged up. So I was looking for something to happen in the S&P this week.
The wheel shown is for Monday, the 10th. It showed both a square and octagon touching the S&P
natal Sun (green H), and natal Venus. Natal Venus conjoined by Neptune was 3/8th ( think Fib)
of a circle from Mars. So I was expecting to see a change in the S&P this week, and something
harmonic.
The second chart shows the S&P for this week. There was indeed a change in behavior as the
rally up from June 3rd stalled. By early Tuesday, it had formed a classic "three drives to a top."
The third top was a very harmonic 180 degrees up from the 6/3/ low. The 400 hour EXMA went flat.
This chart is one of many on http://daytradingforecasts.com, on the SPKISS page. It shows
various Moon harmonic flux lines. They suggest downward pressure on the S&P.
Yesterday, Thursday, the S&P made an unusual number of intraday swings. This is fibrillation,
a precursor to chaos. Finally, as of now, the weekly candlestick for the the S&P looks like
a bearish spinning top. Over the coming weekend, this will studied by longer term investors,
and factored into computer trading programs.
The third chart is for the gold exchange traded fund. It has jumped since the 5/31/1019
Chaos clinic. So larger investors are clearly seeking safety.
To learn more about my work, I suggest subscribing to my Tomorrow's Market Hotline Email,
available at Moneytide.com
Besides the comments made by Al, the chat room has live
comments from other traders who sometimes share their views,
trades and tips. Below are the chat room comments from this clinic
6/14/2019 2:07:12 PM MT MJ:: https://www.screencast.com/t/GnU7TfvlYIsX
14/6/2007
6/14/2019 2:05:30 PM MT MJ:: Al the Moon Earth and Jupiter line up with the Sun on Monday Last time this happened was in 2007 and the market reversed quite nicely. The moon was on the other side of the earth in 2007
6/14/2019 2:00:26 PM MT Al****:: and now both daily and weekly candles are bearish spinning tops
6/14/2019 1:58:58 PM MT Al****:: esNat72 shows 18 point range, 15 point rally : 7:8 ratio -right out of musical scale
6/14/2019 1:57:20 PM MT MJ:: I went short too lets see what happens this looks like a pump and dump move to me.
6/14/2019 1:52:26 PM MT Al****:: any time. I sure hope God had a good reason for waking me up last Saturday :)
6/14/2019 1:49:46 PM MT ff:: Thx Al for the magic fix
6/14/2019 1:46:27 PM MT Al****:: magic fix, ff; have a great weekend
6/14/2019 1:42:37 PM MT ff:: Just went short 2 minutes ago just after the peak. Holding over weekend.
6/14/2019 1:27:54 PM MT ff:: Any thoughts since the upward breakout?
Also, any bids for gap down Monday?
6/14/2019 12:59:36 PM MT BEW:: wow for the last 30 minutes it cant get above 2888.4
6/14/2019 12:30:10 PM MT Al****:: I'm done for the day; thanks for coming; see you next week; take some courses
6/14/2019 12:18:42 PM MT Al****:: MJ, you may be right. This is a weak market
6/14/2019 12:17:46 PM MT Al****:: trade stopped
6/14/2019 12:14:07 PM MT MJ:: According to my calculation Monday is going to be a low, the 11th was my other cycle point, but the market hardly moved at all, I think this market will gap down over the weekend, whats your outlook AL?
6/14/2019 11:57:24 AM MT Al****:: a stop must go above the last high, say 2887.5. That's a $150 risk
6/14/2019 11:54:05 AM MT Al****:: note now how the 110, 220, and 440 minute EXMAs are "curling down"
6/14/2019 11:49:15 AM MT Al****:: second MoonTide trade was a sell near 2884.5
6/14/2019 11:44:37 AM MT Al****:: I have placed a Face of God chart in the Certified Chaos Trader's Room. That room is open
to graduates of my 4 main courses. See http://moneytide.com -> Courses for details.
eMylar Fractal of Pi overlays help you be patient, since they show you future potential moves.
The best bargain in my courses is to take the Cash In On Chaos and Fractal of Pi courses and
learn to use the FOP overlay. Then take Chaos Trading Made Easy, and finish with Face Of God.
6/14/2019 11:29:27 AM MT Al****:: volatility has died to nothing. 440 minute EXMA down
may get late decline with a volatility expansion
6/14/2019 10:04:04 AM MT Al****:: you see this kind of action when big players are selling big block demanding prices between tight limits
market drops when they are done distributing
6/14/2019 9:55:13 AM MT Al****:: back from breakfast-see more fibrillation
6/14/2019 9:15:41 AM MT Al****:: now may get ugly
6/14/2019 9:13:19 AM MT Al****:: continued high frequencies-lower minor high - peak on Moon T180 time line on SPSunMoon chart
6/14/2019 8:38:04 AM MT Al****:: taking a break now
6/14/2019 8:34:20 AM MT Al****:: minor rally stopped on green level-a stop at 2887.5 might work-no quarantees
6/14/2019 8:31:59 AM MT Al****:: a useful chart here is the esNat72 chart on the Secret page-the vibration levels can help you set stops
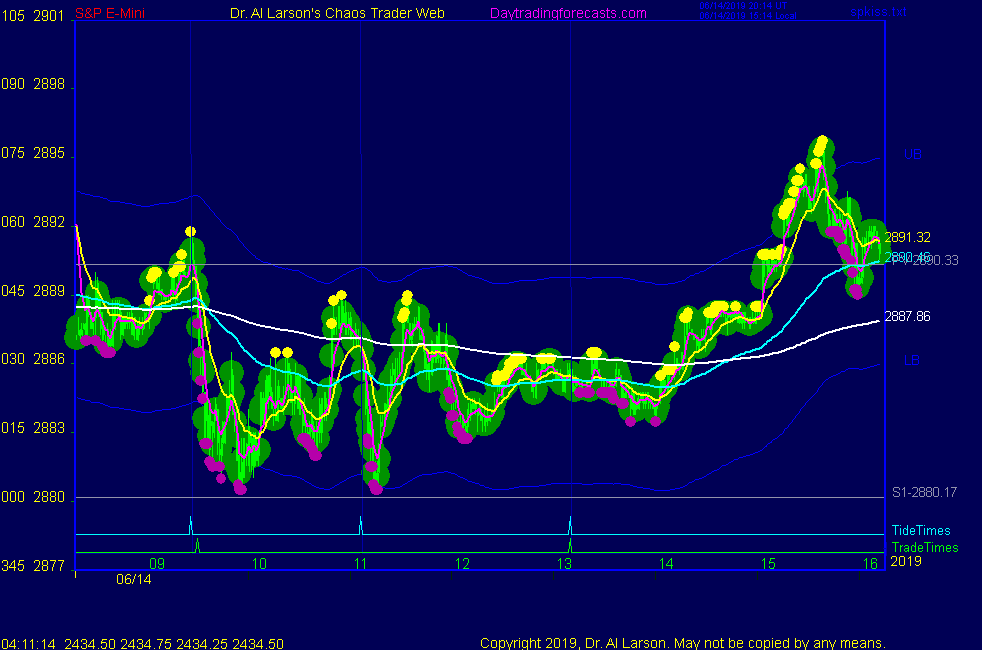
6/14/2019 8:11:40 AM MT Al****:: 9:31 trades are problematic on Fridays. Here you can see the computers sold the pivot at2890. Short term sup[port came in just above S1. Often it is best to wait about 20-30 minutes to see the nature of a rebound
6/14/2019 8:06:58 AM MT Al****:: yes. It just depends on how much risk you are willing to accept
6/14/2019 7:55:25 AM MT BEW:: Well, I guess you could have gone short 951 correct?
6/14/2019 7:52:03 AM MT BOG****:: Thanks Dr. Al. Have a Great Weekend.
6/14/2019 7:41:53 AM MT BEW:: with this wild swing in the SP is it still possible/advisable to make a 930 trade?
6/14/2019 7:40:38 AM MT Al****:: BOG and other CCT's: I have posted a Face Of God chart in the CCT Room.
6/14/2019 7:39:17 AM MT Al****:: 9:30 was a red -Tide high
6/14/2019 7:38:18 AM MT Al****:: OK, Chaos clinic is posted.
6/14/2019 7:34:38 AM MT BEW:: wow, what happened at 930 in the S&P?
6/14/2019 7:29:10 AM MT Al****:: GM all. Still working on Chaos Clinic. Should be posting it in about 10 minutes.
6/14/2019 7:22:44 AM MT RR:: GM all.
9:00 Eastern-System: No comments


[ Live Clinics on Friday on DaytradingForecasts.com ]


