
Chaos Clinic Recap
Here are Al's comments
1:37 I'm done with the clinic for the day. Thanks for coming. See you next week. Take a course or two.
Best buy is to take Cash In On Chaos and Fractal of Pi and learn to use the Fractal Of Pi Overlay.
1:33 looks like the rest of the day is up a bit
1:32 I was nervous because my entry was going into the Tide turn, and gap was closed
1:30 covering for +1
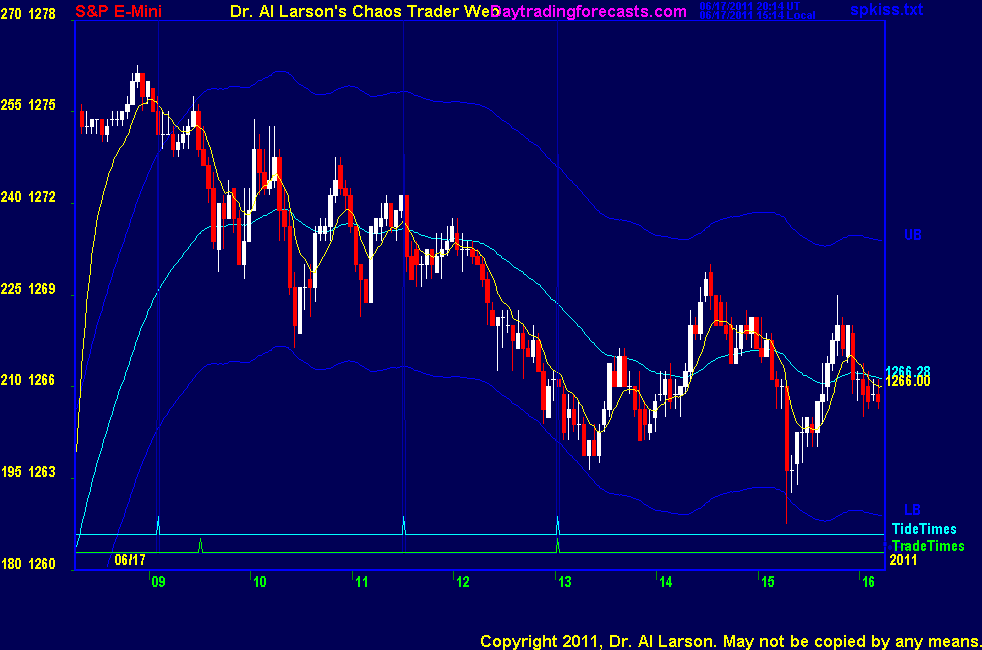
1:27 stopped at yesterday's close, so gap up is filled
:
1:25 stop to 1265.5
1:22 stop to 1265.75; at critical break further or bounce point
1:21 stop to 1266
1:17 lowering my cover point to 1259 near Sun/Node flux; stop to 1266.25, breakeven
1:15 yesterday's drop had a sharp bounce. Don't want to get caught by one today
1:13 stop to 1267-needs to break soon
1:05 stop to 1267.25-risk down to one point
12:59 Sun and Node near 1259-solstice price is 1260. No guarantee that we get there
12:56 I will cover 1261 if we get there-about 9 points up from yesterday's low
12:54 stop to 68; that Face Of God chart nailed this one
12:52 stop to 69
12:51 stop to 1269.25-don't want to risk more than 3
12:45 stop to 1270-not sure this thing is going top break; just got hex patter; could be a stable point
12:42 elected short 1266.25 , stop at 1271
12:25 dip did not yet hit stop; if hit, will put buy stop at 1271, above 110 EXMA
12:21 putting a sell stop at 1266.25, one point under low of day, and below the 440 EXMA.
12:20 coming into the second trade window. Looking weak.
11:55 looks like everyone has gone out for a long lunch.
11:37 I have placed a Face of God chart in the Certified Chaos Trader's Room. That room is open
to graduates of my 4 main courses. See http://moneytide.com -> Courses for details.
11:21 That trade would have had to been in place by 11:00, and the price entry price would have had to been one tick
higher, at 1268.25 ; but it would have caught a 3 point bounce so far. One has to be very focused and nimble to
execute that setup. That's the sort of thing computers are good at, properly programmed.
11:15 that technique is an attempt to buy away from the 110 EXMA for a return to it and hopefully through it.
The 110 is basically flat, and prices are trading both side of it. This is not a hotline rule, just an advanced technique.
11:11 If I were to do that, I'd place a buy limit at 1268, stop 1266.50, shopping for a good entry price.
11:06 from the early high there are 7 moves, counting this one. So pullback may end soon. I sometimes buy this setup
based on gap up, down to 11:00, and 7 moves.
11:03 still congesting-looks like a low coming near the 11:31 Tide time
10:40 on the MTRainbow or any other two day chart, you notice yesterday mornig was verychoppy, but the afternoon was
much smoother. Hopefully that happens today.
10:34 we are in the Never-Never Land between a falling 110 and a rising 440 EXMA. On two day chart
I'd call this a move 4 of 7 in an up Chaos Clamshell. Maybe next Trade time will give us a good trade.
10:26 on the MTRainbow chart we are now in between the 110 and 440 EXMA's; high near Node +O000 flux, low so far on +O315
Node is part of an eclipse
10:24 I've learned not to chase the S&P. If you don't get anything on a trade, stick to your plan. Next trade is near 13:02
10:20 early trades on Friday are especially difficult. My target was missed by one tick. Factor that in next time.
10;17 stopped for -.5 ; which is fine. Loss was controlled. That's all you can control.
10:15 patience
10:12 stop to 1271.5
10:07 anytime early trading is more than 18 points of yesterday's low, it is vulnerable.
10:04 I don't expect much here, so I will cover at 1275 = last minor high if we get there
10:03 moving stop to 1271, just under the 110 EXMA
10:01 did continuation buy at 1272 stop 1269
9:55 Today I am running a Research in Progress chart in in the Certified Chaos Trader's Room. That room is open
to graduates of my 4 main courses. See http://moneytide.com -> Courses for details.
9:48 when I see a big early morning move like this I suspect the news has been leaked in advance. Also, I know
hedge fund computers are programmed to trade these reports. They are in and out fast, adding a lot of noise. So I usually wait until they are done before trading.
9:46 we have two economic reports at 9:55 and 10:00 - Consumer sentiment and Leading indicators. Economic News is
linked on the right side of the ListOfCharts page.
9:41 support on the 2650 and 110 minute EXMAs; does not look like much swing portenial either up or down; just waiting
9:37 on a gap up day, there is a tendency for the market to pull back into about 11:00. Our hotline trading rules
are "go with the trend" rules. We do not take counter trend trades because we found them much less profitable and harder
for newbies to execute.
9:33 on the MTRainbow chart, you can see the EXMA's are very diverged. Each longer term EXMA is a potential support point.
Major support should come near the 440 EXMA - about 1264.5
9:26 Opening with a big gap up. Trade times are 09:31 and 13:02 . Too far from 110 EXMa for good setup on first one right now.
9:00 Good morning from Chaos Manor
Besides the comments made by Al, the chat room is has live
comments from other traders who sometimes share their views,
trades and tips. Below are the chat room comments from this clinic
6/17/2011 7:15:37 AM MT Al****:: GM all-good luck today
9:00 Eastern-System: No comments


[ Live Clinics on Friday on DaytradingForecasts.com ]