
1:48 I'm not making a second trade. Thanks for coming. No clinic next week due to 4th.
See you in two weeks. Take some courses.
1:44 turned out to be a good decision
1:37 taking 4.5 on stall; too much buying in my 2088 Natural support area
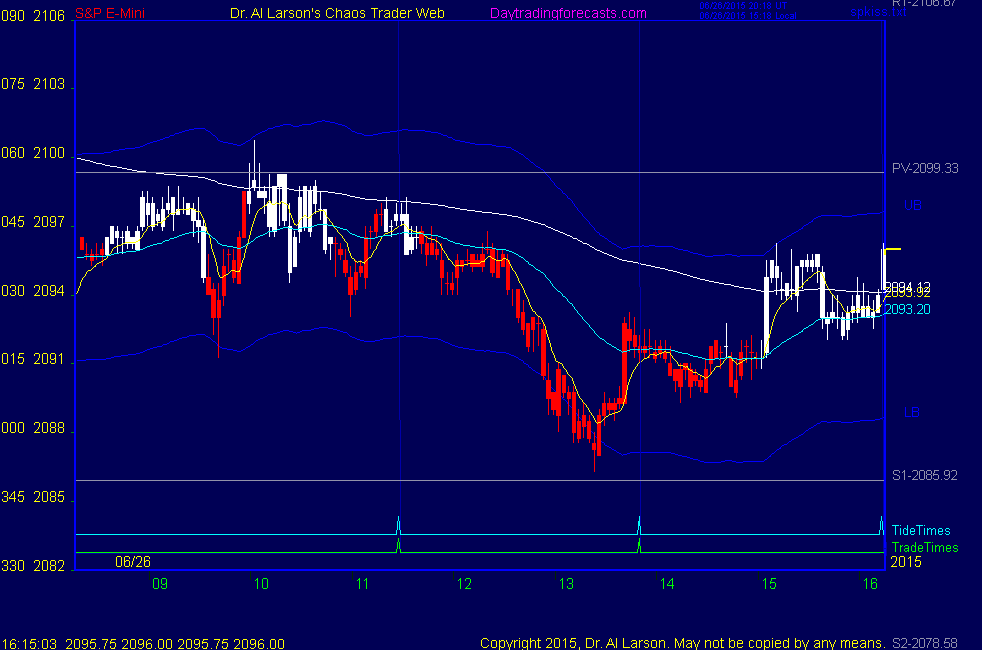
1:24 stop to 2090; between the 55 and the 20; XTide has an up pulse here
1:20 stop to 2091
1:17 stop to 2091.5; 55 minute EXMA is at 2091.35
1:13 placing my cover stop at 2084.5 , 9 points; there may be more but I'll
take 9 and pour the wine.
1:12 stop to 2092, just above the 55 minute EXMA. On a fast move this EXMA will
not be broken until the move is over.
1:09 I have placed a Face of God chart in the CCT room. It suggests we reach 2082.
It shows the energy center point that turned prices down.
1:01 stop to 2092.5; lock 1
12:58 stop to 2093
12:57 I also was looking at a Congestion Ellipse to see if I could determine when the flat would end. I have
placed a chart showing that ellipse on the AUX page where everyone can see it
12:50 the real sell time was right on the 11:28 Tide time; I just dis not see enough juice to get me interested.
12:46 early in the day I was not interested in selling. My ephemeris work, pattern analysis,
and the actions of the EXMAs changed that.
12:42 the early high hit the pivot price; the next lower one is S1 at 2086
I have Natural support near 2088
12:37 taking this as an early continuation sell; sold 2093.5 stop 2096.5
All the EXMA's rolled over
12:35 breaking off the flat - need to watch closely
12:29 in this case the flat was set by Pluto
12:18 when it gets very quiet like this I look at the ephemeris and figure out why prices are being held where they are
this has taught me a lot about how the natal chart works as it is activated by the current planets
12:15 Back-see I did not miss anything
11:44 I am going to pass and take a breakfast break
11:40 this trade may be a PASS
11:37 one really wants to stay out of congestions.
11:35 I was not elected ; cancelling my buy stop since the short EXMA's turned back down
11:32 440 stopped the rally so far, so it looks like the congestion is continuing
11:24 OK, placing a buy stop at 2098.5, just above the 440 minute EXMA; 20 is crossing 55,110, and 220
11:21 the short term Fractal Efficiency tends to follow XTide. This is shown on the SP CTME chart.
If you are a Certified
Chaos Trader, you have a link to this chart on the right side of the List Of Charts page.
11:26 at the bottom of the Chaos Clinic chart is a magenta line marked XTide. This is a forecast of the very
short term energy flow. The swings have basically been following it.
11:16 trying to rally again- need some juice and some follow through for a decent trade setup
10:50 prices are trading both sides of the 110; this means stay out.
10:45 I'm not interested in selling, since the down move is old and may be done. I'm not interested in buying
unless we make a new high
10:39 coming into the trade window - market holding up but trading in a range; 440 EXMA slowly down,
110 slowly up: never never land
10:31 I have placed a NinjaTrader Fluxline chart in the Certified Chaos Trader's Room. That room is open
to graduates of my 4 main courses. See http://moneytide.com -> Courses for details.
eMylar Fractal of Pi overlays help you be patient, since they show you future potential moves.
The best bargain in my courses is to take the Cash In On Chaos and Fractal of Pi courses and
learn to use the FOP overlay. Then take Chaos Trading Made Easy, and finish with Face Of God.
10:21 If you have your sound on, you hear the sound announcing a hex resonance patter. See the
tutorial and Hex Wheels today, linked on the rifht side of the List Of charts page.
10:14 setting inside the range of the day. May stay there all day .
10:08 We still have a while before the first trade time, so just watching
10:03 if you look at the SPSunMoonMer chart, you see this fast rally streaked up the V90/
H45 ( Venus, Sun)
timelines and went from the Moon -T135 to -T090 electric field flux lines
10:01 rally broke above the 440 minut EXMA, and above the privot price. It has now moved a harmonic 9 points.
9:58 on the MTRAinbow chart, you see three slightly lower lows. Traders call this "Three drives to a bottom."
This pattern usually means a low is in.
9:48 the bounce off those lows suggests the down trend may have bottomed. That does not mean a rally
will follow immediately. We could spend the whole day trading inside the range.
9:45 the speed of that move tells me the Flash Boys were ready to test the overnight lows. Before you trade
anything,
do yourself a huge favor and buy and read the book "Flash Boys."
9:41 below that I have Natural support near 2087-89
9:34 today is the continuation of a down trend that started on the 22nd.
It is late in that move, so prices are probing for a bottom.
Overnight support came in near 2091
9:32 today we have 2 trades: 11:28 13:50
9:00 Good Morning. Welcome to the Chaos Clinic. This site has a lot of charts,
so you may find it useful to have several of them available within your
browser. If you have a tabbed browser, you can open separate charts
in separate tabs by right clicking on any link, and selecting "open in new tab"
from the menu. The main list of site pages is at
http://daytradingforecasts.com/chartlistsec.asp
Recommended pages to watch are SPKISS, MTRainbow, and Chat.
For astro stuff, add SPSunMoonMer, Wheel, and Chaos Clinic.
Chaos clinic comments appear at the bottom of the SPKISS, MTRainbow,
and ChaosClinic pages. Comments in the chat room are announced by a
"duck call" noise. This noise also occurs when the sofware detects a
resonant hex pattern on the Wheel page. Trading tutorials
are on the right side of the ListOfCharts page. One should
read Trading the MoonTide Tutorial and Keep it Simple as a minimum.
9:00 Eastern-System: No comments
![]()
![]()