********************************************************************************
The S&P Goes Chaotic on 7/9/2020
Chaos Clinic for 7/10/2020
********************************************************************************
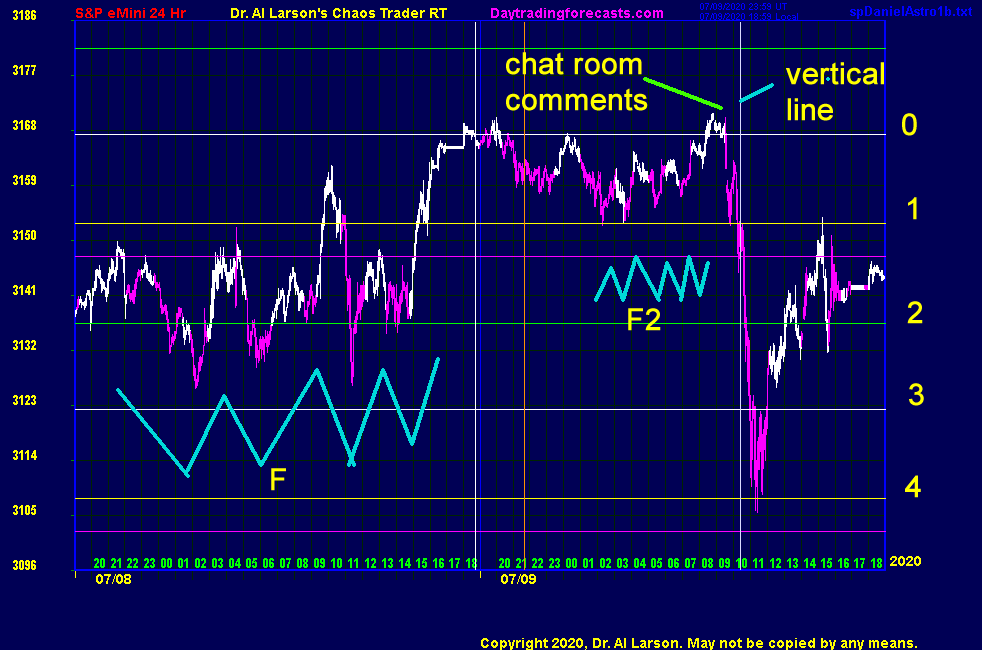
This chart shows the chaotic action of the S&P futures on July 9, 2020.
It is a version of the Secret->esnat72 chart on daytradingforecasts.com
The chart shows two days of 24 hour data. The time is in Eastern Daylight Time.
The chart has vertical lines marking key Market Astrophysics events, and horizontal
lines marking natural vibration levels.
On July 8th, prices swung up and down mostly between the green and yellow levels.
There was no clear trend, but a cyclic oscillation with swings of 2-4 hours.These
are labeled F. Late in the normal session, prices rallied to a session high.
On the white timeline, they reached the white vibration level.
In the overnight session, prices pulled back to the yellow vibration level. Early
in the morning of July 9th, prices began a rally to the white level.
When I looked at the chart after rising near 7 AM Eastern, I notice two things,
which I noted in the chat room:
at 9:04 EDT: "on two day 24 hour chart I noticed that the swing cycles today are much shorter
than yesterday- a frequency doubling, which is a precursor to chaos"
These are the F and F2 patterns.
at 9:25 EDT: " note vertical line on Secret->esnat72"
When these lines fall in the regular session, they can mark especially high energy moves.
These comments proved prescient. Prices dropped from vibration level 0, down 4 levels to yellow level 4.
The drop took less than 3 hours.
The rest of the day, prices bounced 3 vibration levels to yellow level 1. This 4:3 ratio is known in
music as "the fourth." It is the ratio of the F note to the C note in an octave. So even in a chaotic
move, there is hidden harmony.
Frequency doubling is one of the topics covered in the Cash In On Chaos course.
It and other courses can be found at Moneytide.com

7/10/2020 10:03:14 AM MT Al****:: I'm done for the day-have to get the camper ready. Thanks for coming. See you next week. Take some courses.
7/10/2020 10:02:04 AM MT Al****:: not much on first MoonTide trade - reluctantly bought 3149 covered for +5
7/10/2020 9:00:17 AM MT Al****:: Secret->esNat72 shows a 7 move up Chaos Clamshell from the low about 2:20 AM
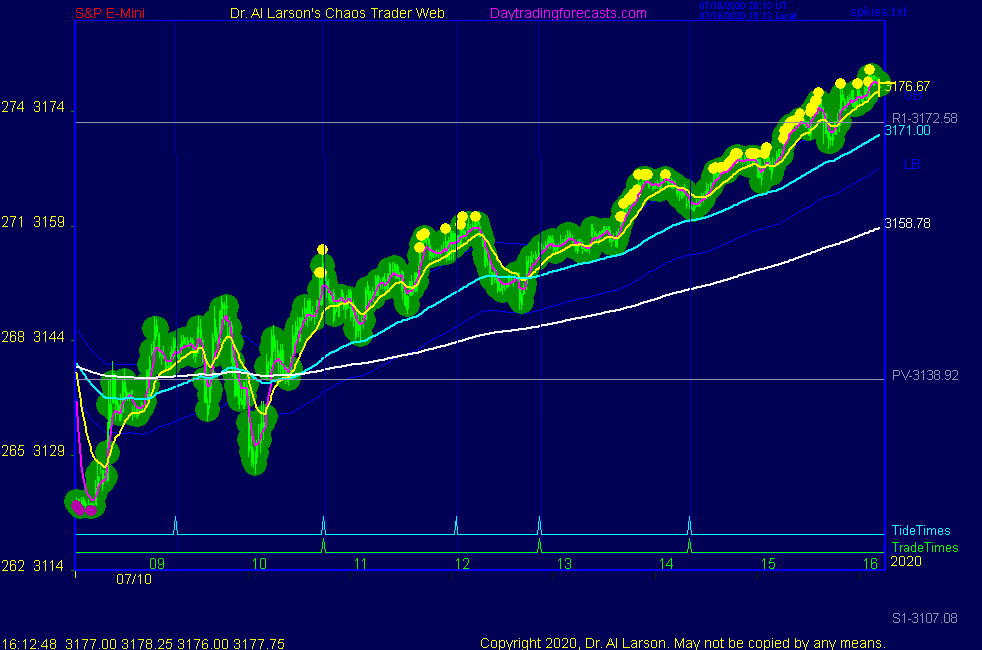
7/10/2020 8:57:00 AM MT Al****:: note Chaos Clinic chart showed possible buy going into first trade time, and Secret->esNat72 showed rally to yellow vibration level in
a test of the overnight high
7/10/2020 8:06:34 AM MT Al****:: so far today trade has been choppy-the MTRainbow chart has flat EXMAs, and the Chaos clinic chart has several bar color changes
I try to stay out of congestions as best I can
7/10/2020 6:37:49 AM MT Al****:: Good Morning visitors. Welcome to the Chaos Clinic.
The written Chaos Clinic is on the AUX page.
This site has a lot of charts,
so you may find it useful to have several of them available within your
browser. If you have a tabbed browser, you can open separate charts
in separate tabs by right clicking on any link, and selecting "open in new tab"
from the menu. The main list of site pages is at
http://daytradingforecasts.com/chartlistsec.asp
Recommended pages to watch are SPKISS, MTRainbow, and Chat.
For astro stuff, add SPSunMoon, Wheel, and Chaos Clinic.
A special set of Dr. Al's research charts are on the Secret page.
Comments in the chat room are announced by a
"duck call" noise. This noise also occurs when the sofware detects a
resonant hex pattern on the Wheel page. MoonTide trading tutorials
are on the right side of the ListOfCharts page. One should
read Trading the MoonTide Tutorial and Keep it Simple as a minimum.
Many subcribers do not strictly trade the MoonTides, but use the charts on this
site as input to their own trading strategies. For example, the bottom chart on the
SPKiss page is good starting point for swing traders.
Also on this site is the Certified Chaos Trader's Room. That room is open
to graduates of my 4 main courses. See http://moneytide.com -> Courses for details.