********************************************************************************
Has the S&P Topped Out?
Chaos Clinic for 7/24/2020
********************************************************************************
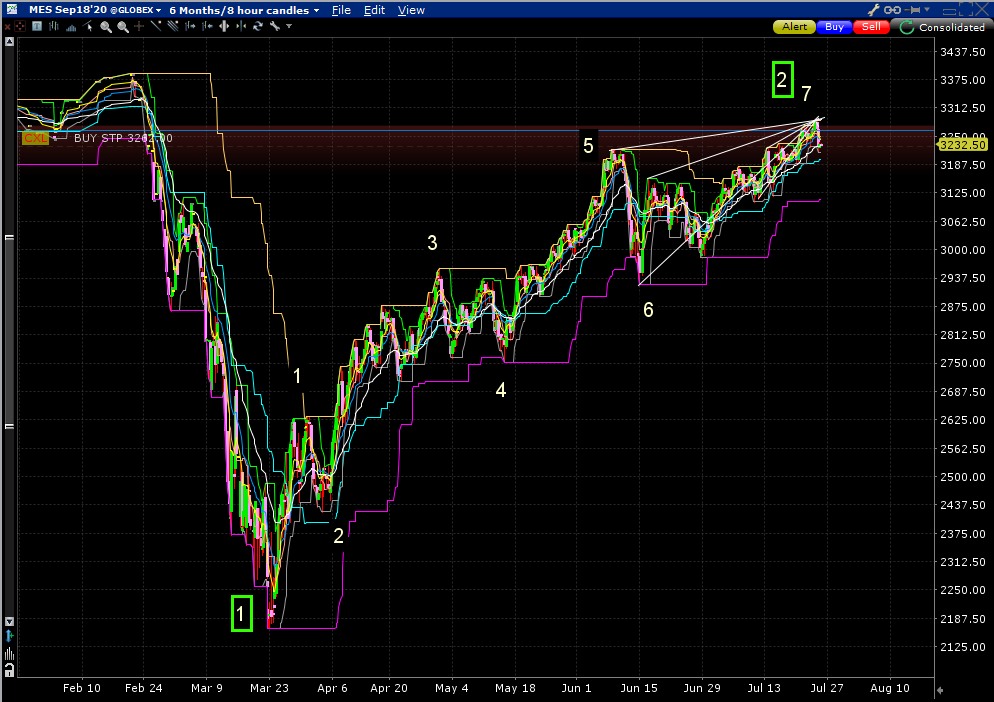
This chart shows the September S&P micro futures contract over the past six months.
This chart was first posted in the Certified Chaos Trader's chat room at 1:29 Eastern,
7/23/2020 when prices were at 3248.25. That early version was available to hotline
subscribers who are also CCTs.
This chart covers the sharp drop when the Corona Virus hit the US, forcing a shut down
of much of the economy, in the down leg labeled with a boxed 1. That drop
ended in late March.
Since then, as the country has struggled with the virus and it's economic impact,
the market has rebounded strongly, in what is now a four month rally. The rally was helped
by the 3 trillion dollar stimulus package. Congress is now debating another package.
But it becoming clear that it will take more than money to put COVID-19 behind us.
While the other averages have made new highs, the S&P has not. So I have labeled the rally
as a boxed move 2. Inside that move, I see an arguable 7 moves, as in a Chaos Clamshell.
Before the pandemic hit, many economists were concerned about a global recession. Technically,
we are in one now. With 1 out of 5 workers in the US jobless, the US is in one now. It
is hard to believe that while Main Street bleeds, that Wall Street will keep soaring.
Chaos Clamshells have 7 moves, so if this is a valid CC, there is much downside ahead.
More on my work can be found at Moneytide.com

7/24/2020 9:40:06 AM MT Al****:: back from breakfast - trade is flat on white vibration
I think I'll call it a day and go get the camper ready
charts will run to close. See you next week. Take some courses
stay safe
7/24/2020 9:00:53 AM MT Al****:: aborted for -4; going to breakfast
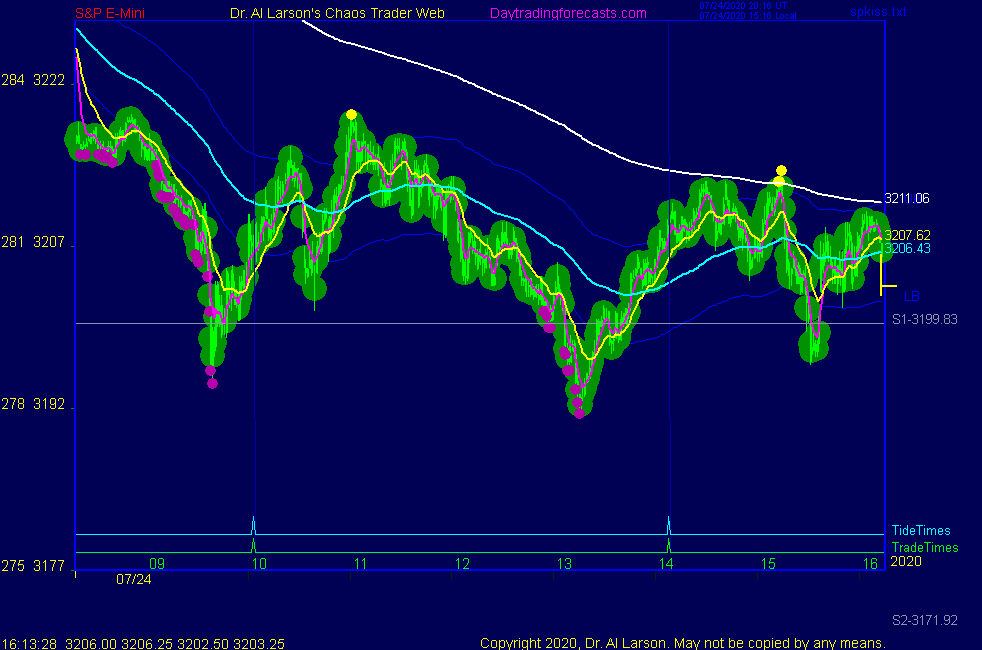
7/24/2020 8:51:46 AM MT Al****:: on the SPSunMoo chart, I see the price hit the Mercury flux line and the Moon timeline
7/24/2020 8:39:12 AM MT Al****:: meanwhile, I did not think I was going to day trade the first trade, so took the dogs to the park. Came back and saw the bounce up to the white vibration level on the Secret ->esnat72 chart, so sold 3213.25
7/24/2020 8:36:47 AM MT Al****:: the Creator smiled upon me
7/24/2020 8:28:51 AM MT Ahab****:: Al, kudos on SP3XGO forecast.
7/24/2020 8:15:54 AM MT Al****:: Good to see you srj; hope all is well with you and yours
7/24/2020 7:15:19 AM MT srj****:: GM AL, all
7/24/2020 7:13:30 AM MT Al****:: BOG: I missed your question earlier this week about the vertical lines on the Secret charts - they do not indicate direction, just potential high energy times
Good Morning visitors. Welcome to the Chaos Clinic.
The written Chaos Clinic is on the AUX page.
This site has a lot of charts,
so you may find it useful to have several of them available within your
browser. If you have a tabbed browser, you can open separate charts
in separate tabs by right clicking on any link, and selecting "open in new tab"
from the menu. The main list of site pages is at
http://daytradingforecasts.com/chartlistsec.asp
Recommended pages to watch are SPKISS, MTRainbow, and Chat.
For astro stuff, add SPSunMoon, Wheel, and Chaos Clinic.
A special set of Dr. Al's research charts are on the Secret page.
Comments in the chat room are announced by a
"duck call" noise. This noise also occurs when the sofware detects a
resonant hex pattern on the Wheel page. MoonTide trading tutorials
are on the right side of the ListOfCharts page. One should
read Trading the MoonTide Tutorial and Keep it Simple as a minimum.
Many subcribers do not strictly trade the MoonTides, but use the charts on this
site as input to their own trading strategies. For example, the bottom chart on the
SPKiss page is good starting point for swing traders.
Also on this site is the Certified Chaos Trader's Room. That room is open
to graduates of my 4 main courses. See http://moneytide.com -> Courses for details.