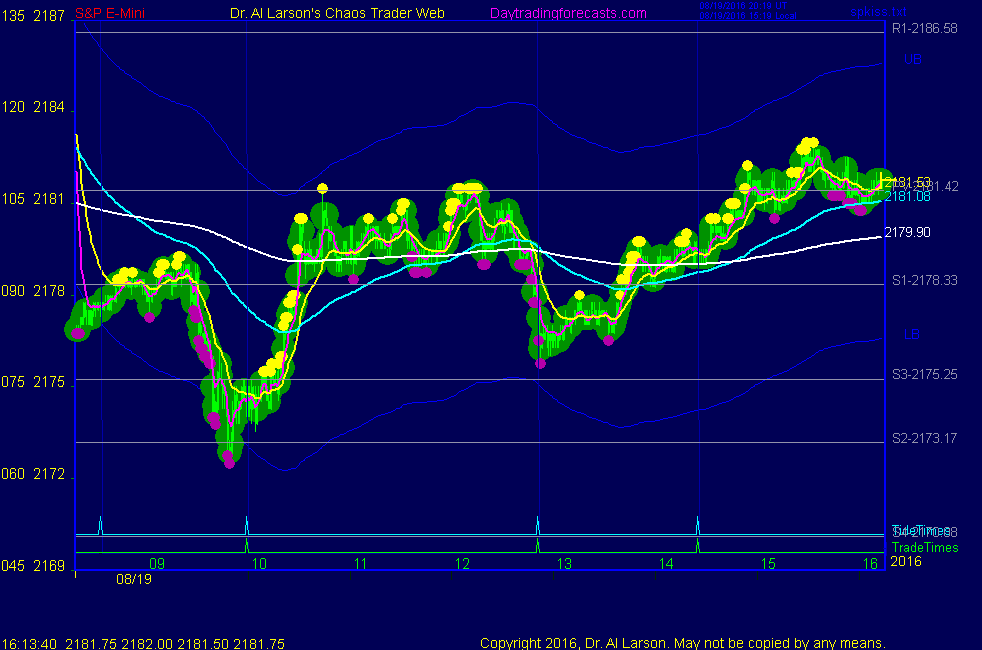


1:52 I'm done for the day; have to get ready for vacation;
thanks for coming; see you in 2 weeks; take some courses
could decline late
1:51 aborting for -1.5; not working
1:24 stop to 2180.5
1:35 still OK - I expect selling near the close
1:13 stop to 2181
1:01 from yesterday, we now have a lower low and a lower high; the definition of a CIT(Change In Trend)
12:54 that sell was based in part on a Face Of God pattern. Posted it in the CCT Room
12:50 sold 2178 stop 2182
12:37 market is dead; rally stalling under 24 hour highs; watch for a late decline
12:15 hex pattern at the pivot price; hex patterns tend to be stabilizers;
The can also mark one end of a 12 point move
see Hex Wheels today and Hex Wheels tutorial, link on right side of ListOfCharts page
11:48 I'm back - I see that market has gone flat
11:16 taking a breakfast break
11:11 often on Friday there is early volatility, then none
11:03 got high at 11:00-now trapped between S2 and the pivot; could stay there all day
10:46 up to the pivot 2181.42; 9 point harmonic range from low
10:35 this leads me back to the "gap down, sell a high at 11:00" pattern;
I probably will not trade it because this looks like a congestion
10:24 that's enough of a bounce to turn the market flat in a congestion
10:21 out for zero
10:12 One reason I jumped in early is because of a Face of God pattern.
I have placed that Face of God chart in the Certified Chaos Trader's Room. That room is open
to graduates of my 4 main courses. See http://moneytide.com -> Courses for details.
eMylar Fractal of Pi overlays help you be patient, since they show you future potential moves.
The best bargain in my courses is to take the Cash In On Chaos and Fractal of Pi courses and
learn to use the FOP overlay. Then take Chaos Trading Made Easy, and finish with Face Of God.
10:09 need to be patient; risk is zero
9:53 got buying at S2; I think it is temporary
9:49 trade looking good; this type pattern (down overnight, selling on the outcry open ) is
one that usually runs one way all day
9:40 stop to 2177; break even
9:38 stop to 2179; risk 2
9:35 on the AUX page I'm showing a longer term chart with multiple harmonics of the Moon electric field flux
9:32 sold 2177 stop 2180
9:28 I am prepared to sell early; red swan may catch prices: SPKISS charts showing possible sell setup
9:18 technically, this is a gap down day, which often holds up until 11:00 Eastern, then sells off;
the flash boys computers sold the pivot at 2181.5, bought s3 at 2175.25, and are trading near S1 2178.33
9:16 today's trade times are 10:00, 12:51, 14:25 ; The market declined overnight, so it is vulnerable to the downside
9:00 Good Morning. Welcome to the Chaos Clinic. This site has a lot of charts,
so you may find it useful to have several of them available within your
browser. If you have a tabbed browser, you can open separate charts
in separate tabs by right clicking on any link, and selecting "open in new tab"
from the menu. The main list of site pages is at
http://daytradingforecasts.com/chartlistsec.asp
Recommended pages to watch are SPKISS, MTRainbow, and Chat.
For astro stuff, add SPSunMoonMer, Wheel, and Chaos Clinic.
Chaos clinic comments appear at the bottom of the SPKISS, MTRainbow,
and ChaosClinic pages. Comments in the chat room are announced by a
"duck call" noise. This noise also occurs when the sofware detects a
resonant hex pattern on the Wheel page. Trading tutorials
are on the right side of the ListOfCharts page. One should
read Trading the MoonTide Tutorial and Keep it Simple as a minimum.
9:00 Eastern-System: No comments