![]()
![]()
********************************************************************************
The Unusual Correlation Of The S&P And COVID-19
Chaos Clinic for 8/21/2020
********************************************************************************
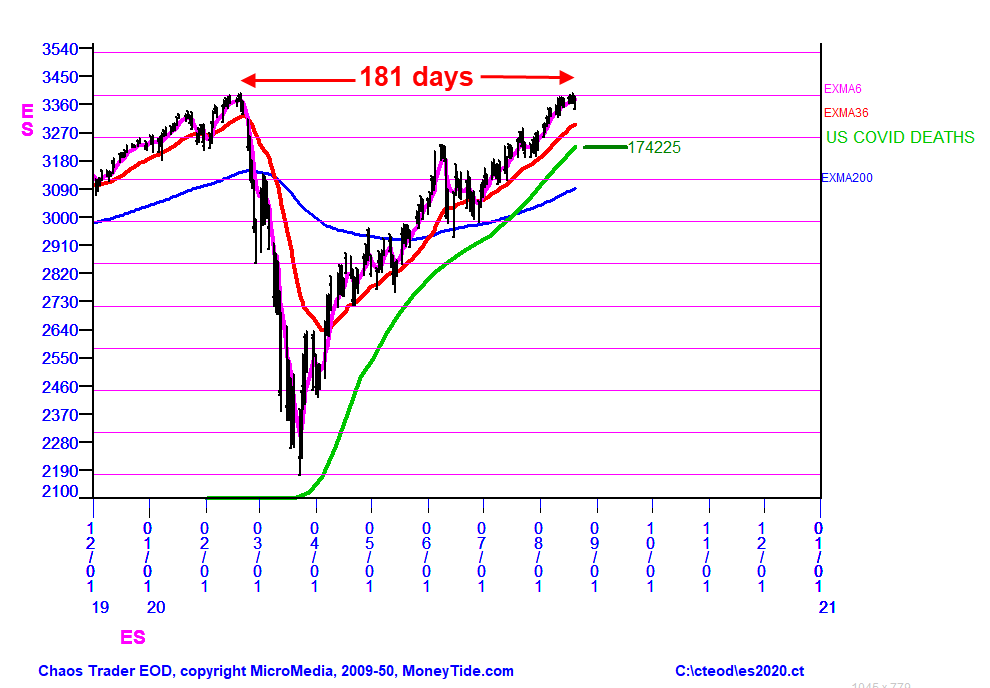
This week the S&P made a marginal new record high, then pulled back a bit.
This chart shows the ES futures contract since December 2019.
Prices have completely recovered from the COVID-19 panic drop early in the year.
In fact, there is an amazing and unusual correlation between S&P prices (black) and
U. S. COVID-19 deaths (green).
Of course, one could explain that the three trillion dollar injection of money into
the economy was the reason for the rebound. Another explanation I have read is that
bond yields are low as the Fed holds rates at zero, forcing money into the stock market.
Whatever the "cause", the effects of COVID-19 on the economy world wide are devastating,
reminding us all, once again, "The market is not the economy."
On a more scientific note, the chart also has several natural vibration levels, shown as
magenta horizontal lines. The panic and rebound cover 9 levels. The musical
scale "whole tone" between the C and D note is a 9:8 ratio, suggesting a pullback of one
or more vibration level may be in order. Another interesting fact is that the two tops
are 181 calendar days apart - one half of a year. That suggests a pullback is due.
For more on my work see
Moneytide.com
8/21/2020 11:38:09 AM MT Al****:: as I leave, I posted a chart in the CCT Room - it is from the Chaos Trading Made Easy Course
8/21/2020 11:23:33 AM MT Al****:: totally dead. Calling it a day. See you in two weeks. Stay Safe.
8/21/2020 10:54:26 AM MT Al****:: coming into last trade window - very sluggish
8/21/2020 10:40:20 AM MT Al****:: not much juice on the bounce as shown by the 20 minute EXMA slope and curl over
8/21/2020 10:22:14 AM MT Al****:: a modest dip and bounce at second Tide time -not selected by trade filter software as a trade time
8/21/2020 10:04:43 AM MT Al****:: basically, yes
8/21/2020 9:57:56 AM MT BOG****:: Thanks Dr. AL, so it seems that the best trades using the SECRET charts is inbetween the vertical lines I'm I correct? Thanks.
8/21/2020 9:31:21 AM MT Al****:: yes - especially since, in this case, it fit the sell a high at 11:00 tendency
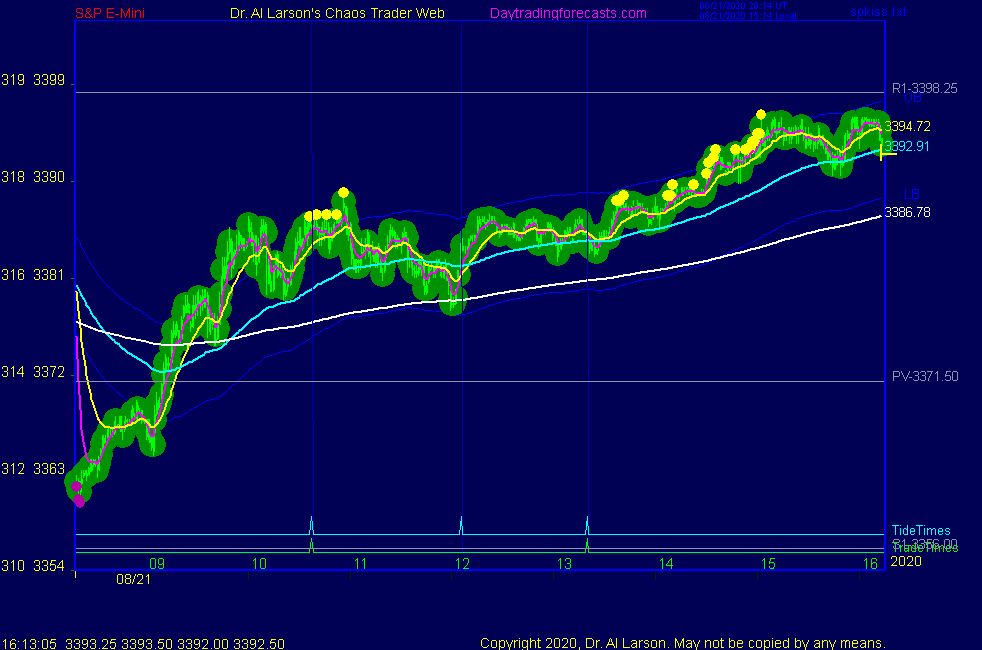
8/21/2020 9:27:38 AM MT BOG****:: Dr. Al, on the SPKISS 4th chart when the yellow push balls become narrow and form a convex merge, can one expect market to turn there? Thanks.
8/21/2020 9:22:06 AM MT Al****:: on the 4th chart on the SPKISS page note the yellow "push balls"
at the highs , the last being an isolated one
these showed that prices are having trouble pushing higher
8/21/2020 9:05:51 AM MT Al****:: now note that the rally up has 7 little moves, and prices look to be tracking the green +Tide
8/21/2020 8:44:14 AM MT BOG****:: Thanks much.
8/21/2020 8:11:47 AM MT Al****:: the ones we just passed; often get streaks up or down them that end after passing them
8/21/2020 8:07:05 AM MT BOG****:: Dr Al, Good Morning, which of those vertical lines makes you not want to buy?Thanks for answering
8/21/2020 8:01:50 AM MT Al****:: got s rally as per the tendency
third chart on SPKISS page shows market trading both sides
of the 110, 220, 1nd 440 minute EXMAs
knowing about the vertical lines on Secret charts makes me reluctant to buy
8/21/2020 7:12:48 AM MT Al****:: on the MTRainbow chart, which is one of my "spliced 8 hour" charts,
running from 8:15 to 16:15 Easter, there is a gap down.
This pattern very often holds up until 11:00,
giving a tendency for "Gap Down, well a high at 11:00"
8/21/2020 6:38:12 AM MT Al****:: on Wednesday in this chat room, before the afternoon break,
I pointed out the rising wedge on a two week hourly chart since I thought it would be of interest to option and swing traders. Now on a 24 hour chart one sees a failed retest of the high of the wedge. One had to be alert last night to trade that retest, but it was possible.
8/21/2020 6:06:40 AM MT Al****:: that Clinic was written last night, and the decline it suggested looks to be underway
note in the Secret->esnat72 and Daniel chart the two sets of vertical lines near 00:00 and 09:00 Eastern
also note the yellow cycle on the Daniel chart - I try to use it for swing trades
8/21/2020 5:59:05 AM MT Al****:: Good Morning visitors. Welcome to the Chaos Clinic.
The written Chaos Clinic is on the AUX page.
This site has a lot of charts,
so you may find it useful to have several of them available within your
browser. If you have a tabbed browser, you can open separate charts
in separate tabs by right clicking on any link, and selecting "open in new tab"
from the menu. The main list of site pages is at
http://daytradingforecasts.com/chartlistsec.asp
Recommended pages to watch are SPKISS, MTRainbow, and Chat.
For astro stuff, add SPSunMoon, Wheel, and Chaos Clinic.
A special set of Dr. Al's research charts are on the Secret page.
Comments in the chat room are announced by a
"duck call" noise. This noise also occurs when the sofware detects a
resonant hex pattern on the Wheel page. MoonTide trading tutorials
are on the right side of the ListOfCharts page. One should
read Trading the MoonTide Tutorial and Keep it Simple as a minimum.
Many subcribers do not strictly trade the MoonTides, but use the charts on this
site as input to their own trading strategies. For example, the bottom chart on the
SPKiss page is good starting point for swing traders.
Also on this site is the Certified Chaos Trader's Room. That room is open
to graduates of my 4 main courses. See http://moneytide.com -> Courses for details.
9:00 Eastern-System: No comments
![]()
![]()