![]()
![]()
********************************************************************************
S&P Doubles During The Pandemic
Chaos Clinic for 9/10/2021
********************************************************************************
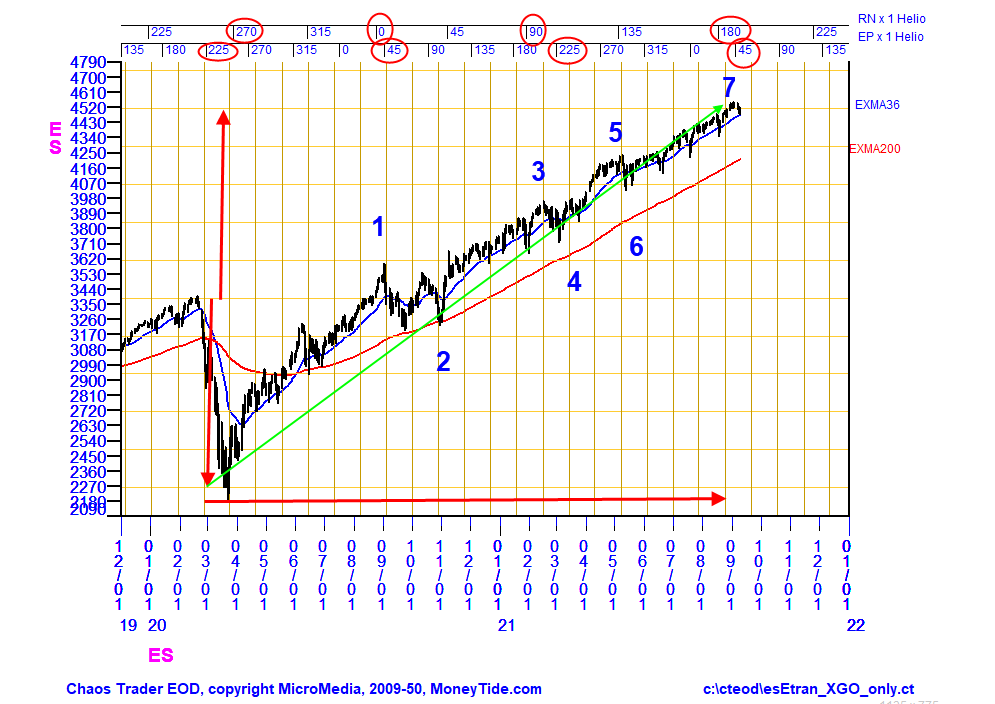
This chart shows the S&P futures over the past 22 months, covering the period of
the COVID-19 pandemic, which still rages worldwide.
The background of the chart is a yellow grid showing price vibrations levels
and related matching time lines, which are lunar months.
The pandemic panic price drop in February and March of 1920 was 5 price vibration levels.
Once the US government began injecting money into the economy in March 2020, prices
began to rally. Now, 19 "Moonths" later, prices have rallied twice as far as they dropped.
In fact, from the low, prices have doubled. I'm reminded of one of the first market books I
read, "Happiness Is A Stock That Doubles In A Year",by Ira U Cobleigh. published Jan 1, 1967.
Along the top of the chart I have plotted two astro cycles that show up in the S&P.
In the natal chart of the S&P, the Sun opposes Pluto, here plotted as the helio EP cycle.
In the natal chart, Mars squares Neptune. plotted as RN. Aspect synch points are circled.
The pandemic rally is 270 degrees, 3/4 of a circle, motion of RN, and 540 degrees
or 3/2 of a circle motion of EP. This harmony suggests a possible pullback ahead.
The first pullback to the 200 day EXMA came eight "Moonths" into the rally in early November 2020.
Since then the rally has held well above the 200 day EXMA. While finding the end of such a
powerful rally is difficult, using the 36 day EXMA as a help, I have labeled a possible
7 moves of a Chaos Clamshell.
Twenty years ago, the high was September 3rd. So far, this year the high is September 3rd.
The twenty year cycle is the Jupiter-Saturn cycle, W. d. Gann's Master cycle.
This is not a suggestion to sell, but a cautionary flag.
For more on my work and to subscribe to Tomorrow's Market Email Hotline and access to daytradingforecasts.com see
Moneytide.com
Software to plot electric field flux lines in NinjaTrader is available at
energyfieldtrading.com
9/10/2021 11:52:23 AM MT Al****:: thanks for coming-see you next week. Take some courses.
Or sign up for Tomorrow's Market hotline TODAY and get an extra month FREE,
9/10/2021 11:46:20 AM MT Al****:: as often happens on Friday, all the action is early
so I'm going to call it a day
9/10/2021 11:23:52 AM MT Al****:: bounced up to green vibe on Secret->esnat72 and 440 minute EXMA
a thrust and a retrace
9/10/2021 10:31:13 AM MT Al****:: according to the Chaos Clinic chart bar colors the first MoonYide
trade was good for about 18 points>BR>now a buy is not advised due to the longer EXMAs being down
9/10/2021 9:54:43 AM MT Al****:: the second chart down on the Chaos Clinic page shows red and green swans - today's down is on a red swan
learn about these on the [MoonTides and Black Swans] page linked on the right side of the ListOfCharts page
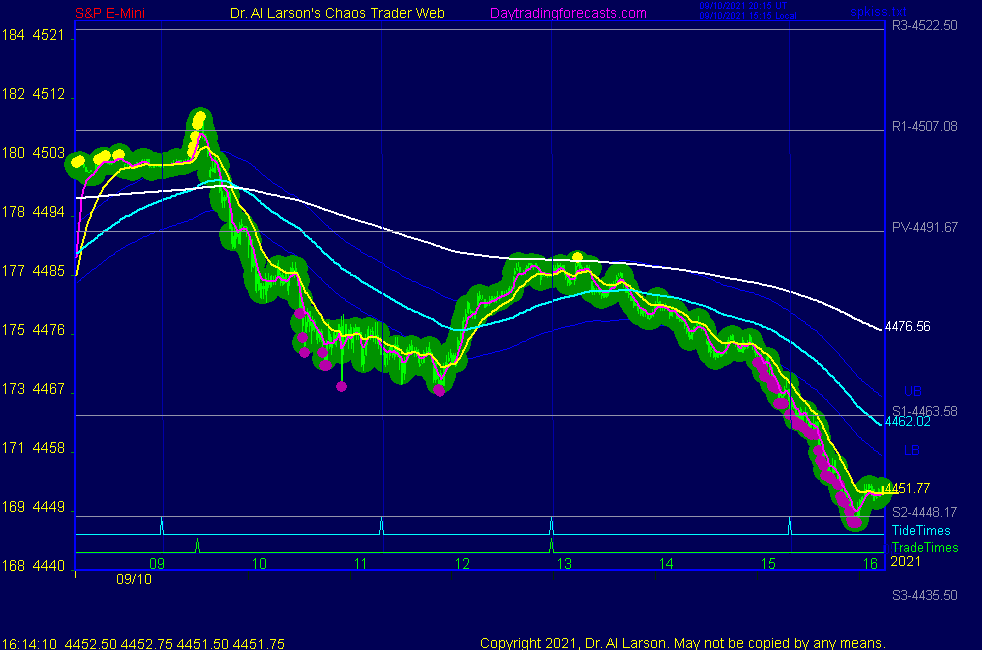
9/10/2021 9:44:12 AM MT Al****:: chart 6 on the SPKISS page has a nice set of EXMAs. Note the cyan
6 day. This seems to guide a lot of auto trading programs that trade "reversion to the mean" strategies. Today those algols
ran prices up to it in the low volume overnight market, then reversed with volume
9/10/2021 9:35:12 AM MT Al****:: today is the second day when the December contact is being actively traded. So far it has more volatility than the September. This downswing is the first with any real volume
9/10/2021 9:24:56 AM MT Al****:: there are two MoonTides, the plus green and the minus red
prices may move from one to the other near a turn, so do not assume anything - use your tracking EXMAs as stop guides
9/10/2021 8:59:49 AM MT Al****:: note the bar colors on the Chaos Clinic chart - they are a good aid in making the MoonTide trades
9/10/2021 8:48:40 AM MT Al****:: chart 6 on SPKISS page shows rainbow of EXMAs turning down
9/10/2021 7:41:51 AM MT Al****:: note on Secret->esnat72 chart the possible up Chaos Clamshell ending on the normal session open with a spike high on R1
9/10/2021 7:06:04 AM MT Al****:: Good Morning visitors. Welcome to the Chaos Clinic.
The written Chaos Clinic is on the AUX page.
This site has a lot of charts,
so you may find it useful to have several of them available within your
browser. If you have a tabbed browser, you can open separate charts
in separate tabs by right clicking on any link, and selecting "open in new tab"
from the menu. The main list of site pages is at
http://daytradingforecasts.com/chartlistsec.asp
Recommended pages to watch are SPKISS, MTRainbow, and Chat.
For astro stuff, add SPSunMoon, Wheel, and Chaos Clinic.
A special set of Dr. Al's research charts are on the Secret page.
Comments in the chat room are announced by a
"duck call" noise. This noise also occurs when the software detects a
resonant hex pattern on the Wheel page. MoonTide trading tutorials
are on the right side of the ListOfCharts page. One should
read Trading the MoonTide Tutorial and Keep it Simple as a minimum.
Many subscribers do not strictly trade the MoonTides, but use the charts on this
site as input to their own trading strategies. For example, charts 5 and 6 on the
SPKiss page are a good starting point for swing traders.
Also on this site is the Certified Chaos Trader's Room. That room is open
to graduates of my 4 main courses. See http://moneytide.com -> Courses for details.
9:00 Eastern-System: No comments
![]()
![]()