********************************************************************************
The First Friday Tendency In The S&P
Chaos Clinic for 10/6/2023
written the evening of 10/5/2023
********************************************************************************
There is a First Friday tendency in the S&P. The monthly jobs report is released
at 8:30 Eastern on the first Friday of each month.. The report itself is widely
traded by high speed computers. But I've observed another tendency:
For one or two days ahead of the report, the market "leans up" into the report.
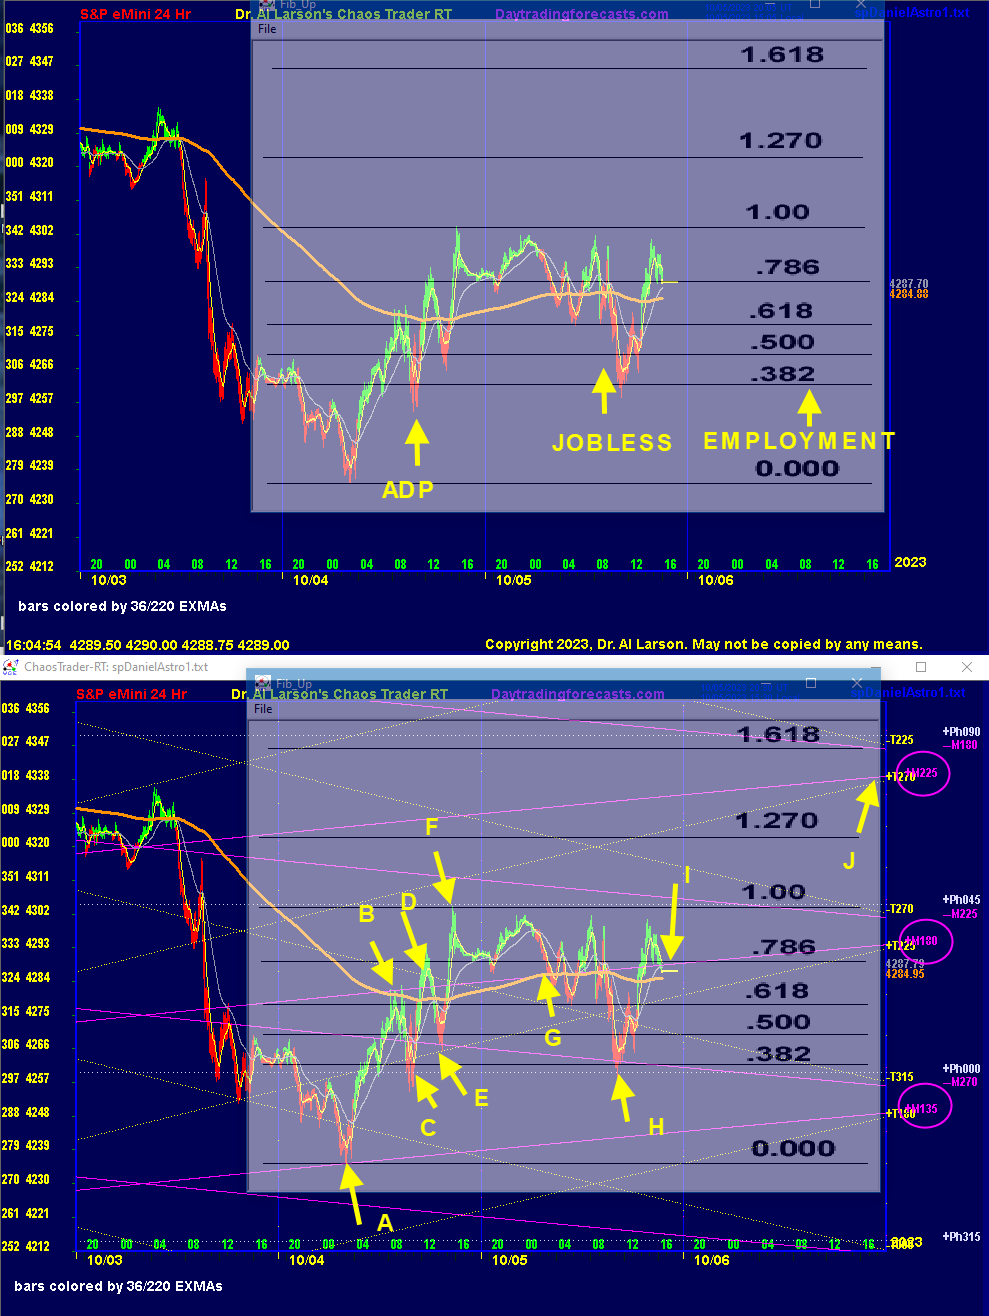
These two charts show how this is playing out this October. After dropping sharply for
two weeks, the market rallied on Wednesday. The TV talking heads attributed the rally
to a weak ADP employment report. I wasn't convinced, but decided to look for a higher
low on Thursday, possibly on the jobless claims economic report.
The top chart shows that after the report, the market dropped. But it found support
near a .382 Fibonacci retracement of Wednesday's rally. Fib theory would
suggest a bounce up to the 1.27 of 1.618 level.
My next step was to look at the electric field to see if there was anything to support
this theory. The second chart shows electric field flux lines for the Moon, Mercury,
and Pluto. Key points of interest are pointed to by lettered arrows.
The down move stopped at point A, on the Mercury +Mh315 flux line. The first move up
topped out at B on the +Mh000 flux, a common 45 degree move. The following down move
at C bounced off the Pluto +Ph000 flux line. Pluto provides major support and resistance levels.
The bounce up to D was turned down by the Moon -T315 flux. The drop to E bounced off the
Moon +T25 flux. The final rally to Wednesday's high at F was the +Ph045 flux. So there
had been two 45 degree rallies, one due to Mercury, and one due to Pluto.
Early trading on Thursday saw the 2400 minute EXMA traveling along the +Mh180 flux. It
looked like it might rally from there. But following the jobless claims report prices
dropped to H, where they bottomed on the +Ph000 and -Mh270 flux. These two set the .382 retracement.
The following rally to I made it up to the +Mh180 flux.
So, by Thursday's close the electric field does support a rally on Friday. Just after the Friday close
the Moon +T270 and +M225 flux cross. From point A, this would be a harmonic 90 degree move on the
Mercury flux. With two bounces off the +Ph000 flux, the +Ph090 would be near the 1.618 fib level.
Will this happen? We shall see.
For more on my work and to subscribe to Tomorrow's Market Email Hotline and access to daytradingforecasts.com see
Moneytide.com
Software to plot electric field flux lines in NinjaTrader is available at
energyfieldtrading.com

10/6/2023 11:03:35 AM MT Al****:: you as well
10/6/2023 10:50:55 AM MT ejs:: Thank you for the CC enjoy your weekend.
10/6/2023 10:43:53 AM MT Al****:: so I had an OK swing trade, and a good day trade
I'm going to thank the Creator of my Lucky Stars and call it a day
thanks for coming-see you next week-take some courses
10/6/2023 10:40:14 AM MT Al****:: doing the clinic chart last night helped
I got long when the rally was strong and covered
when I saw prices hit the flux pair at point J
10/6/2023 10:35:00 AM MT Al****:: if you look at secret->esnat72 you see the bars colored by the 36/220 minute EXMAs did a good job of getting the direction right.
10/6/2023 10:14:29 AM MT Al****:: took profits: +24 4306 to 4330
my entry was late , prices had hit a harmonic point on esnat72
10/6/2023 10:06:42 AM MT Al****:: up 90 degrees on Moon flux
10/6/2023 10:05:20 AM MT Al****:: secret->esnat72 up 2 white levels
10/6/2023 9:58:38 AM MT Al****:: this is a good example of a chaotic market
10/6/2023 9:56:44 AM MT Al****:: Lewis
10/6/2023 9:47:59 AM MT Pal:: Hi Al, can you mention the author of the book Flash Boys, is it Michael Lewis or Peter Kovac?
Thx
10/6/2023 9:43:26 AM MT Al****:: now the Fib forecast could work out
10/6/2023 9:35:05 AM MT Al****:: had to join the rally
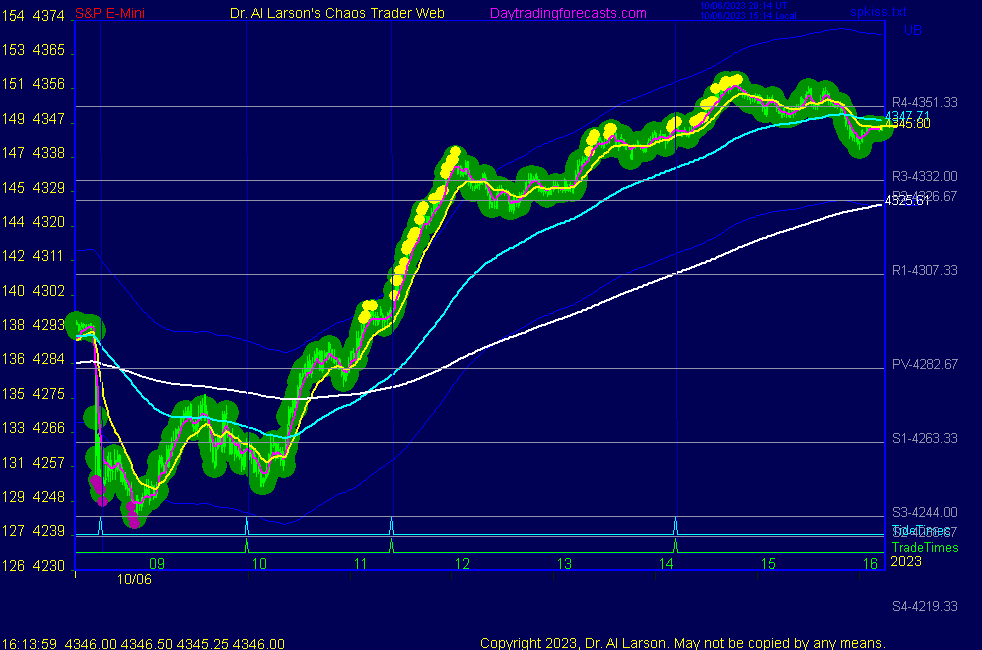
10/6/2023 9:20:36 AM MT Al****:: on the SPKISS page: chart 1 looks like red -Tide
chart 4 shows run up to the upper Larson band with yellow push balls
chart 6 shows 6 day EXMA resistance
10/6/2023 9:14:42 AM MT Al****:: back from taking dogs to the park - see complete retrace of Flash Boy drop
traders really need to read the book Flash Boys to understand those moves - the Flash Boys get in and get out and are done in 7-15 minutes
10/6/2023 8:40:38 AM MT Al****:: I passed on first MoonTide trade - a bit too wild
10/6/2023 7:06:13 AM MT Al****:: now I will just watch. On Secret->esnat72 move went from green to white; 4 15 degree levels, which may be the range
10/6/2023 7:03:12 AM MT Al****:: the leaning up into the report did work for me but not as well as
I had hoped
I was long yesterday at 4271
before the report I moved my stop to 4281
It was filled at 4275. Small gain but not a loss.
10/6/2023 6:54:56 AM MT Al****:: now hitting the Moon +T180 - probable support
10/6/2023 6:45:44 AM MT Al****:: the sell off went down to the +Mh135
10/6/2023 6:43:33 AM MT Al****:: report was sold by Flash Boys - before the report prices ran up to
Mercury +M225 and +Ph045 , which was the Fib 1.00
10/6/2023 6:00:35 AM MT Al****:: Good Morning visitors. Welcome to the Chaos Clinic.
The written Chaos Clinic is on the AUX page.
This site has a lot of charts,
so you may find it useful to have several of them available within your
browser. If you have a tabbed browser, you can open separate charts
in separate tabs by right clicking on any link, and selecting "open in new tab"
from the menu. The main list of site pages is at
http://daytradingforecasts.com/chartlistsec.asp
Recommended pages to watch are SPKISS, MTRainbow, and Chat.
For astro stuff, add SPSunMoon, Wheel, and Chaos Clinic.
A special set of Dr. Al's research charts are on the Secret page.
Comments in the chat room are announced by a
"duck call" noise. This noise also occurs when the software detects a
resonant hex pattern on the Wheel page. MoonTide trading tutorials
are on the right side of the ListOfCharts page. One should
read Trading the MoonTide Tutorial and Keep it Simple as a minimum.
Many subscribers do not strictly trade the MoonTides, but use the charts on this
site as input to their own trading strategies. For example, charts 5 and 6 on the
SPKiss page are a good starting point for swing traders.
Also on this site is the Certified Chaos Trader's Room. That room is open
to graduates of my 4 main courses. See http://moneytide.com -> Courses for details.
9:00 Eastern-System: No comments