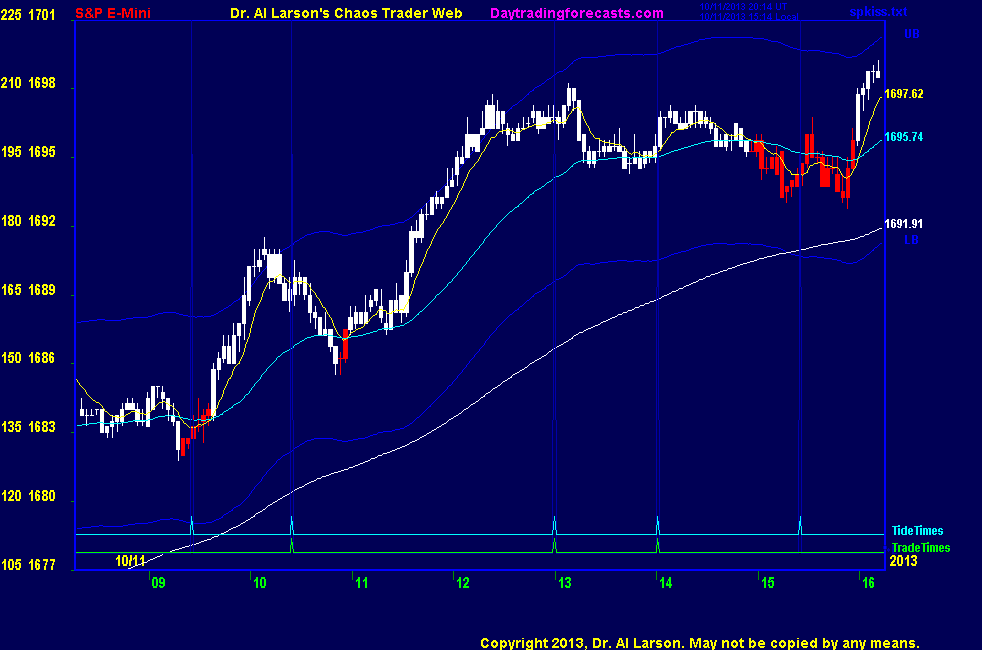


1:20 I'm going to call it a day-was up at 4:30 working on new server; up 9 points; great day;
Thanks for coming. See you next week. Take a few courses. Screens will run to close.
1:16 fell off of the Green Swan
1:13 rally stopped by -T225 flux so far -down turn in green +Tide looks real
1:03 taking +6, don't like this stall
1:00 moving stop to 1695, lock 5
12:56 here I watch the 110 EXMA to see if it keeps moving up
12:51 on that page the XTIDE suggests more rally after 13:00
12:45 still tracking the Green Swan Cycle -see the AUX page
12:37 the pattern of the first two hours is right out of the Cash In On Chaos course.
See http://moneytide.com -> Courses for details.
The best bargain in my courses is to take the Cash In On Chaos and Fractal of Pi courses and
learn to use the FOP overlay. Then take Chaos Trading Made Easy, and finish with Face Of God.
12:35 from the low we have 1-2-3-now in 4 swings of 7 in an up Chaos Clamshell
12:32 if this trade holds up, I will carry it through the 13:00 trade time
12:28 here I'm concerned about the dip forecast by the green +Tide after 1:00
12:24 raising my stop to 1694, 1 point under the Moon +T270 flux, locking 4
12:17 this as the type of day when I like to let a trade run - the market was caught by a Green Swan cycle,
the 110 EXMA is solid up, I got a good entry, and my stops are such that I will not lose money
12:12 reached the congestion region between the Moon +T270 and -T225 flux
12:08 stop to 1692
11:54 now I can sit on this break even stop for a while-momentum is up
11:45 this breakout means we switched to green +Tide - the chart on the AUX page is a research chart studying the
interplay of the MoonTides, the Moon flux, and the Black Swan cycle
11:43 this is a continuation of the first trade-stop to 1690, break even
11:41 the diagonal green line on the AUX screen is the positive Black Swan cycle
11:40 stop 89
11:32 rebought 1690 stop 87
11:31 running a chart on the AUX page showing the mixed MoonTides forming a MoonTide Fractal SEt
11:02 taking a breakfast break now
10:58 at the bottom of the Chaos Clinic chart is a magenta XTide line - it forecast the minor swings during congestions
10:54 the early juice is gone; watching for support on the +T225 Moon flux
10:47 the other scenario is that we just congest between the -t270 and +t225 Moon flux
10:41 that first rally followed the red -Tide; if it holds, the high is in and we sag the rest of the day
10:36 dropping below it; 20 minute EXMA turned down and 110 is curling down
10:33 trading along the Moon -T270 flux
10:28 now I will watch the slope of the 110 minute EXMA ; it decreased, suggesting we may congest
10:25 often on Friday the volatility comes early, then dies off
10:18 given the political rumor nature of the market this week, I'm focused on taking what I can get
10:11 taking +3; may rebuy
10:10 stop to 89, lock 2
10:07 stop to 1687, break even
10:05 rally is 9.25 points, a 45 degree move on wheel of 72
10:00 broke that, so now can raise my stop to 1685.5, just under the +T225 flux
9:58 hit the -T270 Moon flux-may produce a small pullback
9:54 I need to hold my stop where it is until after the 10:25 exact Tide time
9:51 1683 +9 =1692, +18 = 1701 possible targets
9:45 elected long-putting stop at 1683 just below the 110
9:40 entering trade window-putting buy stop at 87
9:38 hit Moon flux
9:37 getting some buying
9:36 not much to go on so far
9:31 outcry session is open-will we get any volume?
9:22 the 110 minute EXMA is flat, and the 440 is up near 1678; Moon flux support below is about 1680 -T315;
Moon flux resistance above is near 1686 +T225 and 1689 -T270
9:21 all the hedge fund programs that trade off economic news are on the sideline due to the government shutdown
9:08 the green +Tide shows an early dip into 10:25, then up all day; range may be about 9 points
9:03 today's trade times are 10:25, 13:00, and 14:01 ; volatility will likely be much lower than yesterday
9:00 Good Morning. Welcome to the Chaos Clinic. This site has a lot of charts,
so you may find it useful to have several of them available within your
browser. If you have a tabbed browser, you can open separate charts
in separate tabs by right clicking on any link, and selecting "open in new tab"
from the menu. The main list of site pages is at
http://daytradingforecasts.com/chartlistsec.asp
Recommended pages to watch are SPKISS, MTRainbow, and Chat.
For astro stuff, add SPSunMoonMer, Wheel, and Chaos Clinic.
Chaos clinic comments appear at the bottom of the SPKISS, MTRainbow,
and ChaosClinic pages. Comments in the chat room are announced by a
"duck call" noise. This noise also occurs when the sofware detects a
resonant hex pattern on the Wheel page. Trading tutorials
are on the right side of the ListOfCharts page. One should
read Trading the MoonTide Tutorial and Keep it Simple as a minimum.
9:00 Eastern-System: No comments