
3:10 stopped out +3.25 -made back most of my error-done for the day-thanks for coming-take a course-see you next week
3:02 may get stopped
2:57 stop to 38, lock 3.25
2:52 looking for a last hour short squeeze
2:46 stop to 37.75, lock 3
2:39 stop to 37.5
2:36 the AUX page is showing the research chart I'm watching
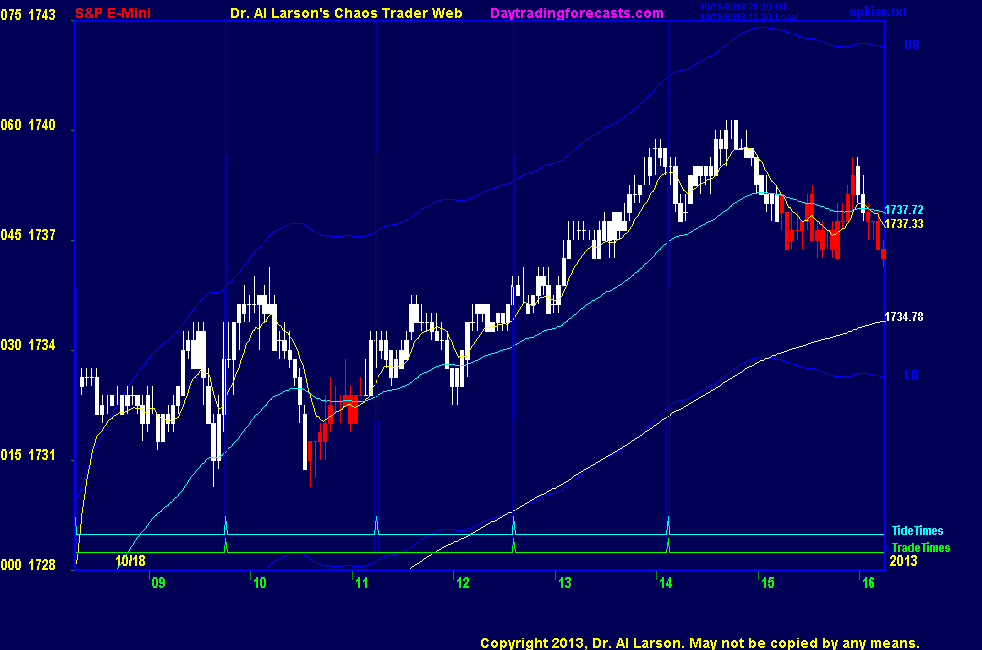
2:31 here the slope of the 110 is up, matching the slope of the red -Tide
2:29 looking good-holding
2:25 stop to 37
2:21 looks like switching from green +Tide to red -Tide
2:19 so far looks like it is
2:15 hoping this is a continuation dip
2:06 stop to 36.75, just under the 110, locking in 2 points
2:01 notice how the 20 and 110 EXMA's are separating - shows acceleration
1:57 yesterday we got a late whoosh rally-looks like a repeat today
1:55 stop to 36.5
1:48 I will just manage this trade into the close
1:45 stop to 36 -cancelling my 41 sell limit
1:40 here I like that trade has stayed one side of the 110 minute EXMA
1:37 stop to 35
1:34 in the third trade window-I will just carry this one through
1:28 this is now a "hold to close" pattern
1:17 110 has risen above my entry, so stop to 34.75, break even
1:14 stop to 34
1:11 putting a sell stop at 1741, just under the next Moon flux pair
1:06 getting some juice now -stop to 1733
1:04 if you have your sound on you hear the "duck call" announcing a hex pattern-see Hex Wheels
today and Hex Wheel tutorial linked on right side of ListOfCharts page
12:55 rest of day looks up-trying to be patient and let go of my early negative bias
12:52 110 still rising - testing high of day
12:49 just noticed I misreported my loss on last trade; should be -3.5
12:41 before the crossing the pair was an attractor-bounce off if suggested pair is now a repellor
12:38 at the crossing of the Moon flux pair-the crossing can add energy
12:34 here I'm watching the steady if slow rise in the 110 minute EXMA and the rising slope of green +Tide
12:26 almost at second trade time-taking as continuation buy at 34.75 stop 32
12:23 the range of the day is only 6 points - not good
12:16 I sold when prices dropped sharply below the Moon flux pair - then got above it, last dip bounce off the pair
12:14 aborted for -4.5 ; held too long -stuck in congestion
12:06 coming into the second trade time - I will not make a new trade but deal with the one I have on
12:02 trade looking better-my bet was that we would not make a new high
11:41 obviously not a good trade entry - probably let it go too far
11:38 coming to the moment of truth
11:27 that pattern is telling me to sit tight; the upward momentum has stalled; expect distribution, then down
11:23 I have placed a Fractal of Pi chart in the Certified Chaos Trader's Room. That room is open
to graduates of my 4 main courses. See http://moneytide.com -> Courses for details.
eMylar Fractal of Pi overlays help you be patient, since they show you future potential moves.
The best bargain in my courses is to take the Cash In On Chaos and Fractal of Pi courses and
learn to use the FOP overlay. Then take Chaos Trading Made Easy, and finish with Face Of God.
11:18 this looks like the high in the green +Tide
11:15 my trade is stuck in a congestion - trying to wait it out
10:51 trading on the Moon flux pair
10:47 adjusting my stop to 1737 for now-above the high
10:18 markets go up, down, and sideways; I think we can eliminate up todday
10:39 I recognized this as a "hook and go" headfake-now have 20/110 sell crossing
10:36 stop at 34
10:32 still in trades window -sold 1731.5 - broke below Moon flux pair- 110 curling over
10:30 it also tells me we are getting mixed Tides, having switched to the red -Tide : congestion
10:27 the lack of follow through on the first rally confirms my concern that we would not have good volatility
10:26 aborted for -1.25 -not moving
10:18 not much juice
10:14 stop to 1732.5
10:08 need to be patient here
10:02 stop to 1732
10:00 looks like following the green +Tide
9:55 elected long - stop at 1731, just under the 110
9:51 putting a buy stop at 1734.75
9:49 add to that that it is Full Moon, which can stall momentum
9:47 all the volatility this week was stimulated by the debt ceiling debate-it is done, so the volatility could be as well
9:43 now we have a dip down to the 110 EXMA so could get a continuation buy; but Moon flux can "trap" price, so I want to see some juice
9:40 we have pinched and crossing Moon flux at 1732.5 and multiples of 9 points from it
these tend to bound the range, so a 9 to 10 point range today can be expected
9:38 first one may be problematic, so I'm waiting a bit
9:36 today's trade times are 09:46 12:36 14:07
9:00 Good Morning. Welcome to the Chaos Clinic. This site has a lot of charts,
so you may find it useful to have several of them available within your
browser. If you have a tabbed browser, you can open separate charts
in separate tabs by right clicking on any link, and selecting "open in new tab"
from the menu. The main list of site pages is at
http://daytradingforecasts.com/chartlistsec.asp
Recommended pages to watch are SPKISS, MTRainbow, and Chat.
For astro stuff, add SPSunMoonMer, Wheel, and Chaos Clinic.
Chaos clinic comments appear at the bottom of the SPKISS, MTRainbow,
and ChaosClinic pages. Comments in the chat room are announced by a
"duck call" noise. This noise also occurs when the sofware detects a
resonant hex pattern on the Wheel page. Trading tutorials
are on the right side of the ListOfCharts page. One should
read Trading the MoonTide Tutorial and Keep it Simple as a minimum.
9:00 Eastern-System: No comments
![]()
![]()