
Chaos Clinic Recap
Here are Al's comments
********************************************************************
Biblical Cycle Leads S&P Lower
Chaos Clinic for 10/19/2018
********************************************************************
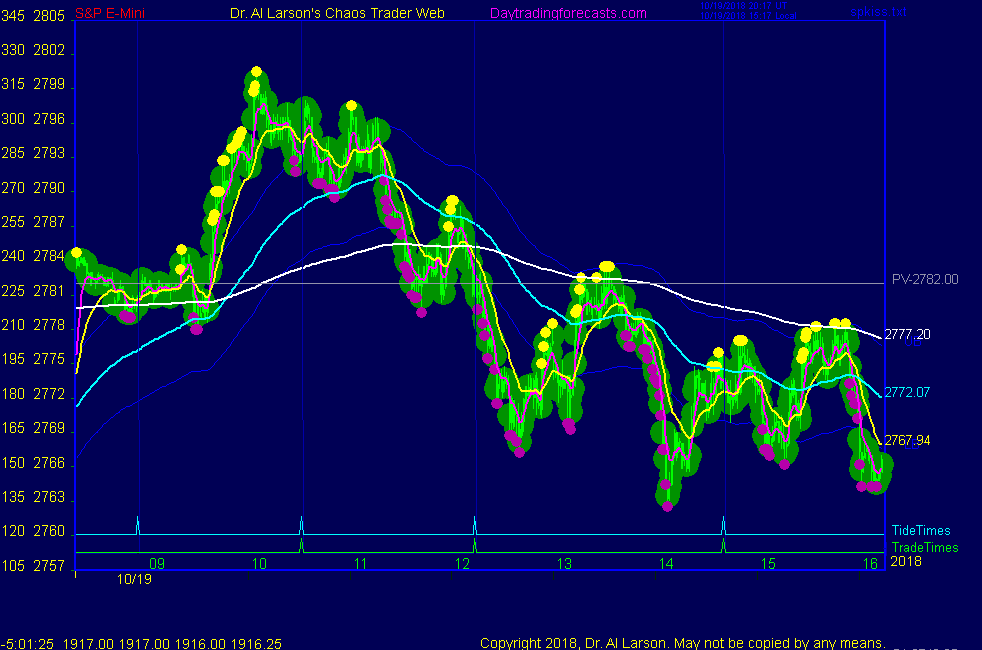
This week the bulls cheered on Tuesday, with a big rally.
Then prices hit the top of a trading channel, making an
edge in the plasma chart. After making 3 lower highs
prices dropped sharply on Thursday. This and more
is shown on the chart on the AUX page.
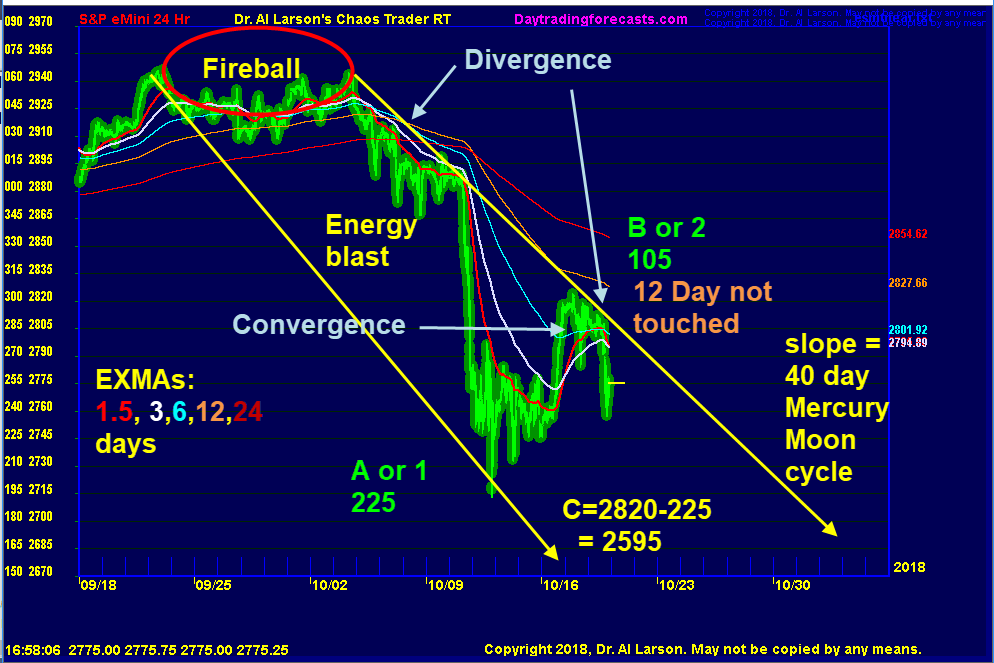
The chart shows the Fireball top starting on 9/21/2018,
on the fall equinox, to 10/3/2018.Trend lines drawn down
from the Fireball energy center show the boundaries
of a downward energy blast.
One week after the end of the Fireball, on the 10th,
prices broke down sharply in a chaotic break. This
drop extended over the next two day into the low marked
A or 1. In 15 point quantums, this was a drop of 225
points, 5/8 of a circle.
That was followed by price churning up and down
until the rally on Tuesday. Then all seemed well.
The decline was stopped. The bulls were back.
Trouble appeared on Wednesday, as prices dropped,
then rallied to a lower high. Another lower high Thursday
morning was a precursor to the sharp drop later in the day.
The rally to point B or 2 was 105 points. A simple ABC
projection where C=A suggests a target of 2595.
One means of tracking moves is to use a rainbow of
EXMAs. On this chart I use 1.5, 3, 6, 12, and 24 day
EXMA. These EXMAs are another form of Gerald Appel's
MACD - Moving Average Convergence Divergence.
From the Fireball to point A, the averages diverged.
Running up to point B, they converged. Then as the
rally failed and prices turned down, they diverged again.
Significantly, the B rally did not touch the 12 day EXMA,
which remains down. In an earlier Chaos Clinic I suggested
the decline could run into January.
The slope of the top of the channel shown is 9 points per
calendar day. That means just 40 days to go 360 points.
This is the well know 40 day biblical cycle ( Christ in desert,
Noah on Arc, etc ). It is the Mercury/Moon cycle, know to
astronomers since antiquity. It shows up in the earth's
electric field, and thus, in price action.
Besides the comments made by Al, the chat room is has live
comments from other traders who sometimes share their views,
trades and tips. Below are the chat room comments from this clinic
10/19/2018 2:19:19 PM MT TG****:: You too
10/19/2018 2:17:24 PM MT Al****:: have a good weekend everyone
10/19/2018 2:15:51 PM MT Al****:: I've seen that-the ancient argument was how to build a good calendar-my Moon or by Sun ; my mentor Ev Garret was an expert on the topic
10/19/2018 2:10:38 PM MT TG****:: I saw a chart that showed the 1929 and 87 crashes overlayed using a lunar calendar as opposed to our standard calendar. Much more aligned that way.
10/19/2018 2:10:11 PM MT Al****:: I really like that my top of channel line was a Red Swan today
10/19/2018 2:04:54 PM MT Al****:: LOL
10/19/2018 2:03:21 PM MT TG****:: Going out weak might set up a better anniversary of 87 come Monday.
10/19/2018 1:59:44 PM MT Al****:: I also like my fractal grids to cover 3 or more days
10/19/2018 1:57:45 PM MT Al****:: I like EXMA rainbows to guide me -the set I used on today's AUX chart are all sloping down
10/19/2018 1:54:32 PM MT Al****:: the overnight market has a lot of game playing
10/19/2018 1:49:50 PM MT TG****:: I see a lot of fractal grids that are best started late in the day and continued the next. Problem is overnight is mine field. Risk reward is very problematic overnight. I've seen these fractals have their base taken out by as much as 3 points, sometimes more, then recover it and the next morning it looks like holding overnight was a piece of cake.
10/19/2018 1:45:27 PM MT Al****:: the other way to handle it is use multiple contracts-cover some, hold some. Some usually means half.
10/19/2018 1:44:00 PM MT TG****:: In terms of intraday or 2-day spliced fractals, I think holding out for Price Quantum 5.5 probably gives the best reward in a world where you have imperfect information at any given time.
10/19/2018 1:43:45 PM MT Al****:: today is a good example-I got a good early sell-my longer term analysis says hold-I can do that with a stop that gives me a 5 point profit; I'll only hold if I can do so with a locked in profit
10/19/2018 1:37:01 PM MT TG****:: got it.
10/19/2018 1:32:57 PM MT Al****:: it a psych test - testing ability to defer rewards -good videos online- do you cover on close or hold on a swing trade, etc
10/19/2018 1:29:26 PM MT TG****:: Al, what did you mean by "marshmallow test"? Are you saying market would be better off letting some air out now vs non stop ramping up?
10/19/2018 1:28:20 PM MT Al****:: breaking that will upset the mutual fund guys-I once went to a promo meeting given by a mutual fund manager-he told me the only technical tool they used was the 200 day SMA
10/19/2018 1:24:18 PM MT TG****:: 2769.75 is the 200 simple mv avg
10/19/2018 1:17:40 PM MT Al****:: the Mercury/Moon aspect coincided with the last trade time and was a high
10/19/2018 1:06:14 PM MT Al****:: that red swan is persistant
10/19/2018 12:54:22 PM MT TG****:: ...Followed by a stick save
10/19/2018 12:53:51 PM MT TG****:: Looked like 15/20 downside cross was going to go right after last tide time...
10/19/2018 12:28:32 PM MT Al****:: those of you who don't want to compete in the futures market,
look at Exchange Traded Funds-SH is an S&P short fund, GLD is a gold fund
10/19/2018 12:22:38 PM MT Al****:: that is for day traders
10/19/2018 12:19:21 PM MT Al****:: TG-Moon timeline is near 15:00, but still looks like a hold to close
10/19/2018 12:18:03 PM MT Al****:: I have placed a Fractal Grid chart in the Certified Chaos Trader's Room. That room is open
to graduates of my 4 main courses. See http://moneytide.com -> Courses for details.
eMylar Fractal of Pi overlays help you be patient, since they show you future potential moves.
The best bargain in my courses is to take the Cash In On Chaos and Fractal of Pi courses and
learn to use the FOP overlay. Then take Chaos Trading Made Easy, and finish with Face Of God.
10/19/2018 12:16:00 PM MT TG****:: Al, is today a 2-moon day, hold to close.
10/19/2018 12:09:47 PM MT Al****:: yes-love it when an analysis works
10/19/2018 12:06:47 PM MT TG****:: Selling the tag of the red swan would have been nice entries
10/19/2018 11:01:01 AM MT Al****:: PYC: see Finer Timing Of The MoonTides, linked top right of List Of Charts page
10/19/2018 10:53:49 AM MT Pyc:: What is yhe 15 20 cross over? Is that new? Why do you do it during tide time
10/19/2018 10:40:15 AM MT Al****:: Thanks Ahab. Good to see you on. Nice comments TG.
10/19/2018 10:13:26 AM MT TG****:: It even worked on the pre-outcry tide time today though there was a throwover to the downside near the open.
10/19/2018 10:12:07 AM MT TG****:: Amazing how often that 15/20 cross over works right at or just after a tide time. Can get confusing at times like late in the day yesterday or on a rounded wide tide forecast but very good on a sharp change in slope forecasted tide turn.
10/19/2018 9:46:13 AM MT Ahab****:: moon flux support?
10/19/2018 9:38:24 AM MT Ahab****:: Nice trading Al.
10/19/2018 9:35:58 AM MT Al****:: that down channel top is Mercury/Moon - they have a 105 degree aspect near 14:30
10/19/2018 9:22:35 AM MT Al****:: stopped and resold
10/19/2018 8:52:45 AM MT Al****:: did sell 2797.5 stop now at break even
10/19/2018 8:41:41 AM MT Al****:: hit top of channel and red swan
10/19/2018 7:05:57 AM MT Al****:: Good. Thanks. You are a good man.
10/19/2018 7:04:27 AM MT gon:: don't worry Al, I did the same before publishing.
10/19/2018 6:58:39 AM MT Al****:: good morning all
GON-I just did the spell check on it and fixed several typos
10/19/2018 5:34:18 AM MT gon:: Hi everyone! Al, AUX article published.
9:00 Eastern-System: No comments


[ Live Clinics on Friday on DaytradingForecasts.com ]