
Chaos Clinic Recap
Here are Al's comments
*************************************************************************************************
Beware The Bear
Chaos Clinic for 11/2/2018
*************************************************************************************************
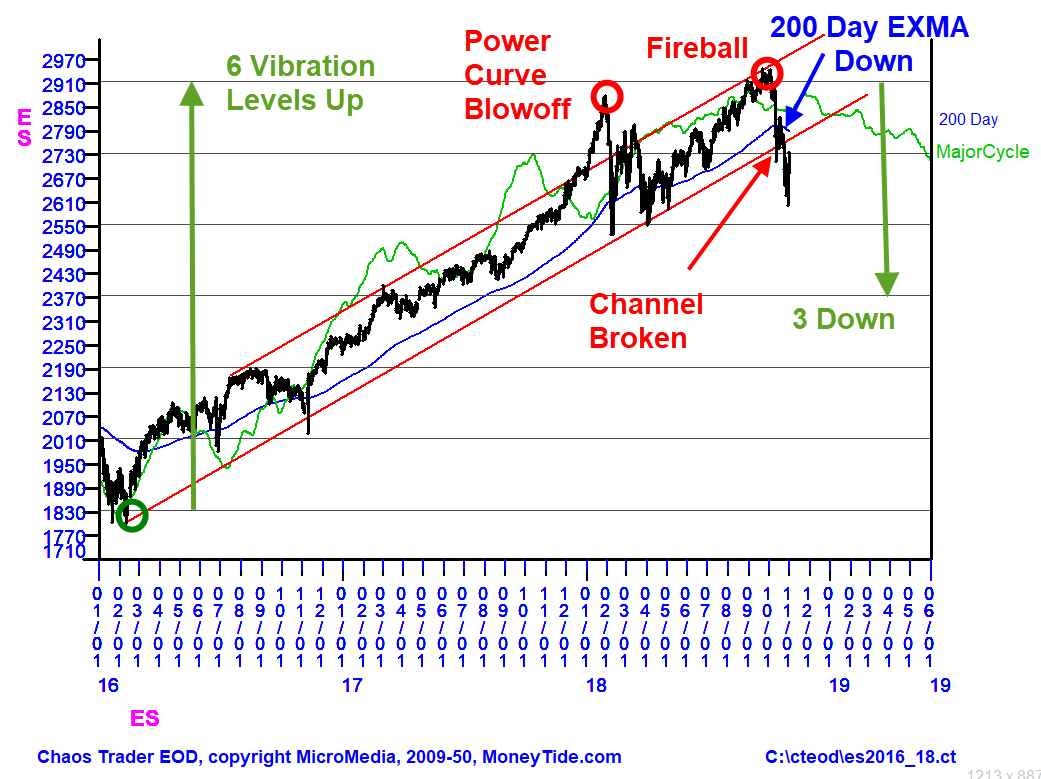
After the S&P 500 made a spike low this week, and bounced sharply, the bulls
have declared that all is well. The chart shown here shows why I do not agree.
Shown on the chart are six energy vibration levels. They represent 30 degree steps on a
Wheel of 720.
In late 2015 the S&P was struggling to go higher. It sold off hard into early February
of 2016. Then it turned up. By the fall, it had rallied over 180 points, about 10 per cent.
The 2016 rally was up two vibration levels.
That rally turned the widely used 200 day moving average up.
Prices sagged nearly one level into the November election, then rallied sharply on promises
of a tax cut. The rally grew steeper and steeper, even after the tax cut was passed.
The rally imploded in February, 2018, after reaching the end of a mathematical power curve.
The rally was 4.66 vibration levels. The number 4.669 is the Feigenbaum Constant
from Chaos Theory. This ratio shows up in chaotic systems so often that it is considered
a universal constant, like the number pi ( 3.142 ) and phi ( 1.618 ). It shows up in all
non-linear systems. You can learn more about chaos in markets in my Cash In On Chaos
course, available on http://moneytide.com
The drop from that blow off dropped prices to the 2550 vibration level. From there it bounced
one level, then came back to test the 2550 level. From there it rallied over the summer. After
stalling near the 2730 level ( 5th up) in June, it began a fast rally to a Fireball top between
9/21/2018 and 10/3/2018 at the 6th vibration level. The decline since then has been fast and furious.
Most significantly, the clear up channel shown by the two parallel red lines was broken by this
decline. Basic trend line analysis says to expect a new downtrend.
The main reason I think this drop has much more to come is that it dropped vertically through
the 200 day moving average, curling it down. This has not happened elsewhere on the chart.
When a moving average is penetrated vertically like this, the following move has a strong
tendency to move in one direction for a time equal to at least the length of the average.
A normal trader's rule of a 50 percent pullback suggests a decline to 2370. The major cycle
ZGO forecast is down into next summer. The rallies in the gold market and short S&P ETF's
show that bigger players are hedging their stock holdings. Personally, I think the Great Bull
market is over, and the Bear is here.
Besides the comments made by Al, the chat room is has live
comments from other traders who sometimes share their views,
trades and tips. Below are the chat room comments from this clinic
11/2/2018 1:43:35 PM MT clb****:: Good weekend everyone. I enjoyed the clinic today.
11/2/2018 1:37:31 PM MT Al****:: and thanks for contributing to the Chaos Clinic
11/2/2018 1:35:32 PM MT Al****:: Have a good weekend everyone
11/2/2018 1:28:47 PM MT clb****:: It is certainly helpful to see the positive, even when it doesn't go the right way.
11/2/2018 1:27:20 PM MT clb****:: TG, that could be a possibility. I can see that on a 30 minute chart. My only hesitation is the potential outside reversal bar on the daily charts that has a larger range than the previous 2. I does look like it holds up today.
11/2/2018 1:23:36 PM MT TG****:: Interesting how the solar noon low was right at intersection of red and green swan.
11/2/2018 1:21:40 PM MT TG****:: I don't know why but I try to see the rosy fractal count/ possibilities
11/2/2018 1:17:32 PM MT TG****:: Just playing devil's advocate here. From the low on 29th, using 24 hr chart, I see a move 1 up of just over 60 pts. A move 3 up of just over 100, a move 5 up of just over 60 pts and a potential move 6 that minorly took out move 4 low of 2704.
11/2/2018 12:49:58 PM MT clb****:: There is quite a bull / bear battle going into the last trade window. There is too much volatility for me until I see a direction. If it breaks at 2700, I had a similar target around 2670.
11/2/2018 12:40:33 PM MT Al****:: rough ABC C=A says about 2665
11/2/2018 12:37:29 PM MT Al****:: pop it up, shake everyone out, then sell the pivot , aided by Moon flux crossover
11/2/2018 12:36:31 PM MT TG****:: Wow, 24 point 3 minute bar
11/2/2018 12:36:21 PM MT clb****:: Wow, that is the 25 point bar on a 3 minute chart. That's the largest one I have seen in awhile. It looks like some entity does not want this market to close below 2700 today. It looks suspicious right before an election.
11/2/2018 12:23:27 PM MT clb****:: Thanks Dr. Larson, You have certainly provided us with really good tools and knowledge to work with.
11/2/2018 12:19:06 PM MT Al****:: CLB is putting charts in the Certified Chaos Trader's Room. That room is open
to graduates of my 4 main courses. See http://moneytide.com -> Courses for details.
eMylar Fractal of Pi overlays help you be patient, since they show you future potential moves.
The best bargain in my courses is to take the Cash In On Chaos and Fractal of Pi courses and
learn to use the FOP overlay. Then take Chaos Trading Made Easy, and finish with Face Of God.
11/2/2018 12:17:07 PM MT Al****:: I love it when someone else does my homework :)
11/2/2018 12:09:28 PM MT Al****:: thanks
11/2/2018 11:37:09 AM MT clb****:: I posted another chart
11/2/2018 11:06:33 AM MT Al****:: I'm also short Dec ES on swing trade- will put stop at break even and
try to hold to expiration
11/2/2018 11:03:57 AM MT clb****:: If the banks and large investors fail to defend 2700, it could go far today. There isn't much support until 2650. I went short last night, hedging my position with options expiring today. I am planning on holding this one over the weekend.
11/2/2018 11:02:15 AM MT Al****:: we have not seen 1000 point days on the Dow - yet
11/2/2018 10:55:51 AM MT Al****:: this is bigger than one day - much bigger - stocks are now being dumped wholesale
11/2/2018 10:47:06 AM MT clb****:: I does seem to be a 1 way day. Officially it is not a 2-moon day, since TO came before the outcry session, but it sure is starting to look that way.
11/2/2018 10:38:33 AM MT Al****:: I was thinking a move 4 would last past the election -guess not
11/2/2018 10:04:56 AM MT clb****:: Last week, I was noticing that VIX had a lower high, even though the S&P was at a lower low. That was a bearish sign to me. It seems that the lack of concern for a lower low in the market shows extreme complacency.
11/2/2018 9:53:34 AM MT clb****:: Yes, and when a trillion dollar company is down 7%, somebody is losing some money. Apple was the stock that just seemed to always go up.
11/2/2018 9:48:35 AM MT Al****:: re Apple: they quit telling investors how many phones they are selling-after doing it for decades ; my daughter told me in January she thought Apple stock was not going to do well since they had already saturated the world
11/2/2018 9:40:18 AM MT clb****:: You are welcome. I was thinking about the possibility that wave 5 is starting today down D4. If today becomes an outside reversal day, then it may be more probable.
11/2/2018 9:37:08 AM MT Al****:: thanks for CCT chart
11/2/2018 9:31:08 AM MT Al****:: doing nothing here-possible red -Tide bottom
11/2/2018 9:29:59 AM MT clb****:: Hello everyone. It could get interesting if 2700 breaks today. It looks like an outside reversal day in the making on a daily chart. I posted a 60 minute FOP chart in the CCT Chat room of what I am looking at now. With Apple down almost 7% today, there may not be much buying interest.
11/2/2018 9:19:45 AM MT BBB****:: All good. finally some fall weather down here.
11/2/2018 8:52:47 AM MT Al****:: sold 2753 took 27
11/2/2018 8:44:02 AM MT Al****:: GM BBB-all OK here-you?
11/2/2018 8:41:16 AM MT BBB****:: GM Al hope all is well
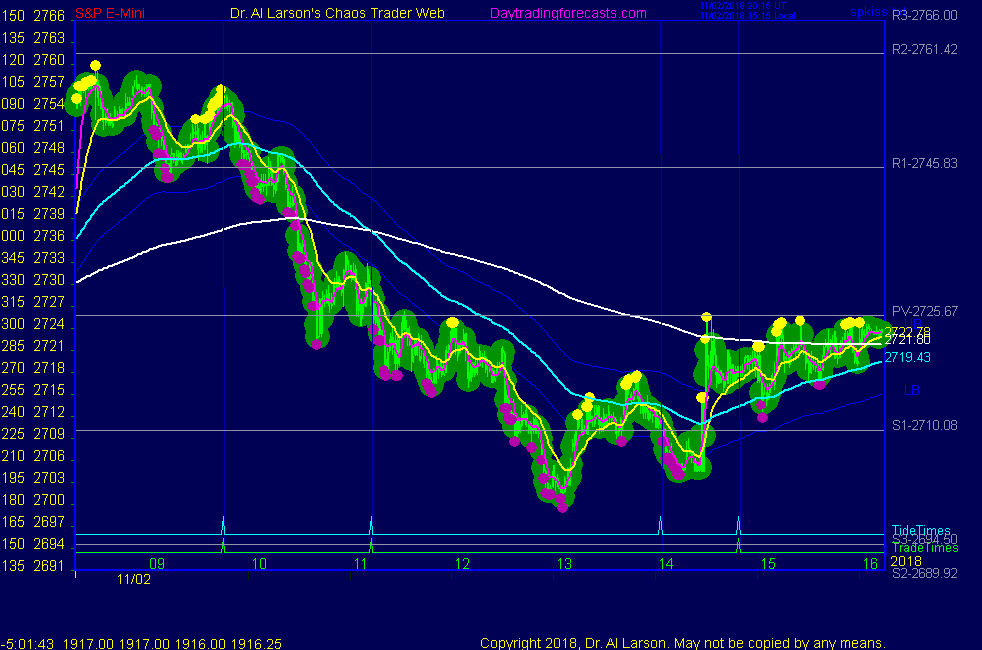
11/2/2018 8:07:09 AM MT Al****:: on SPKISS page see red -Tide nailed it again-been good all week
11/2/2018 7:21:23 AM MT Al****:: computers sold R3 down to R1 - probable trading range
11/2/2018 7:19:00 AM MT Al****:: note on Secret->esNat72 range is 4 white vibrations
11/2/2018 7:16:03 AM MT Al****:: the overnight jump started as the rotating Earth conjoined Uranus ,
then topped as it opposed Jupiter/Mercury and squared Moon;
11/2/2018 6:53:45 AM MT Al****:: Chaos Clinic is posted on the AUX page
11/2/2018 6:25:02 AM MT Al****:: Thanks GON. GM all. good luck today
11/2/2018 6:05:47 AM MT gon:: Hi Al, AUX article published https://www.fxstreet.com/analysis/beware-the-bear-201811021204 Thanks!
9:00 Eastern-System: No comments


[ Live Clinics on Friday on DaytradingForecasts.com ]