********************************************************************************
A Profitable Two Moon Day In The S&P
Chaos Clinic for 11/17/2023
********************************************************************************
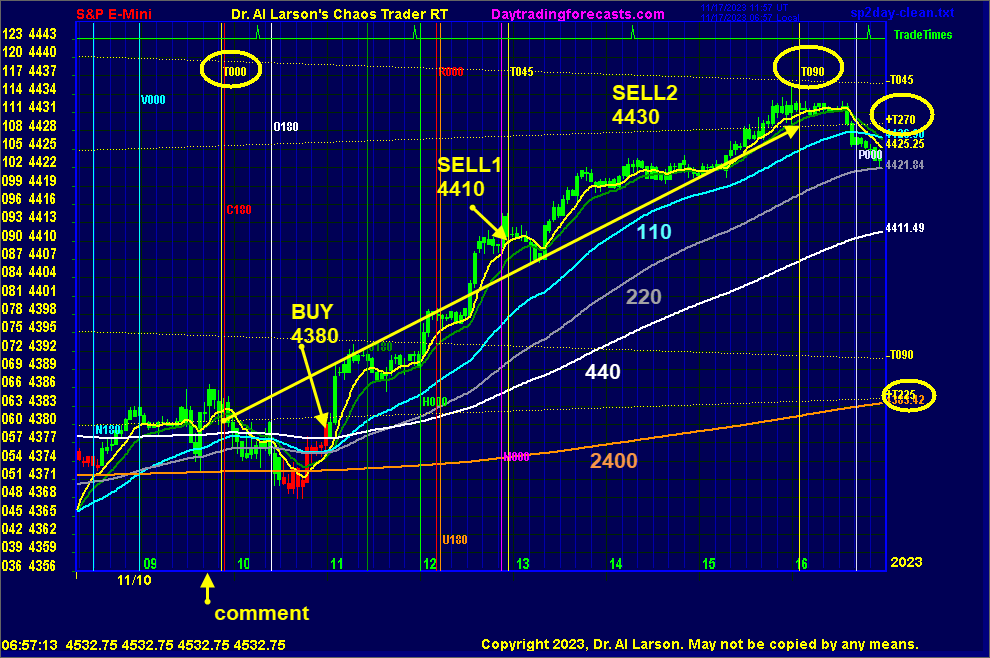
This chart shows the S&P futures for 11/10/2023. At 9:44 Eastern I pointed out in the
daytraingforecasts.com chat room that this was a "Two Moon Day"
with Moon timelines early and late, often volatile and one way, running Moon to Moon,
or Moon-Noon-Moon. The two Moon timelines are the T000 and T090 vertical lines circled on the chart.
Also shown are the Moon +T225 and +T270 electric field flux lines, with labels circled on the right.
Also shown on the chart are the 20, 36, 110, 220, 440, and 2400 minute EXMAs.
Bars are colored by the 36/220 EXMAs.
Initially, prices moved lower, until after the Moon's Node 0180 timeline. Prices found
support on the 2400, then turned up sharply near 11:00, where the bars turned green,
signalling a buy near 4380. From there the rally continued all day, until after
the T090 timeline.
I was lucky enough to buy as show. But I had to leave early, so I covered 4410 at the T045 Moon timeline.
Had I been able to say I would have looked to cover near 4430 Sell2.
This is a good example of profiting from knowledge of Market AstroPhysics. This was a
harmonic move 90 degrees in time and 45 degrees in price.
For more on my work and to subscribe to Tomorrow's Market Email Hotline and access to daytradingforecasts.com see
Moneytide.com
Software to plot electric field flux lines in NinjaTrader is available at
energyfieldtrading.com

11/17/2023 12:42:50 PM MT Al****:: I'm done for the day-thanks for coming-take some courses
11/17/2023 11:17:27 AM MT Al****:: posted chart in CCTRoom
11/17/2023 11:02:40 AM MT Al****:: this MoonTide time is a buy setup on the Mercury time line
11/17/2023 10:15:38 AM MT Al****:: today is also a 2 Moon day - this looks to be a Moon-Noon-Moon pattern
11/17/2023 10:11:56 AM MT Al****:: these days with the 3 vertical lines I call "confusion days" because each line can cause a change of direction- I usually wait and go with the flow after the 3rd line
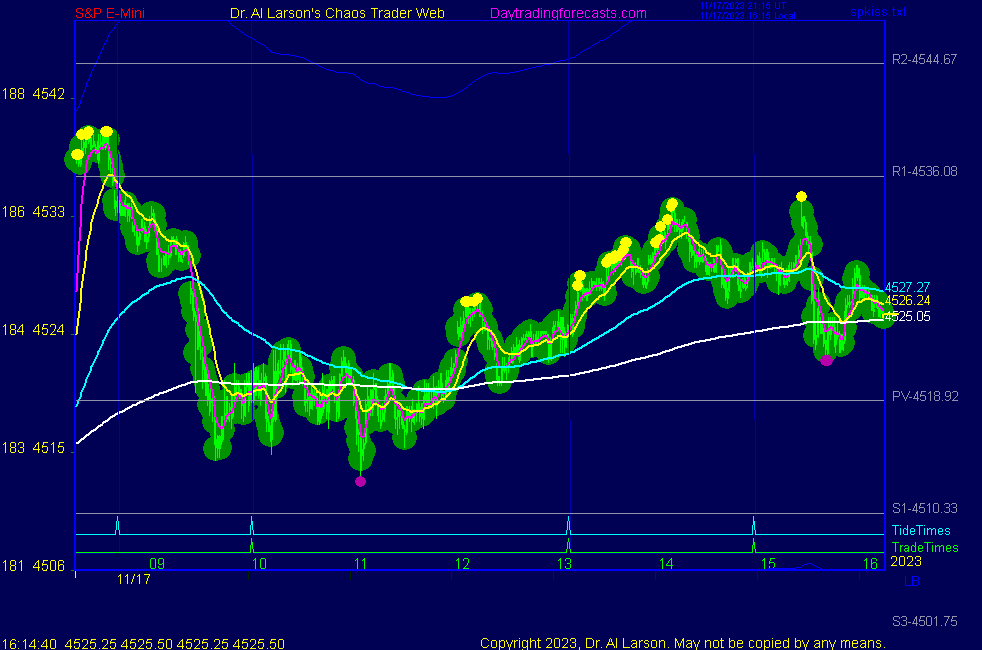
11/17/2023 9:51:02 AM MT Al****:: Flash Boys sold R1 4536, now trading at pivot 4519
may drop to S1 or lower
11/17/2023 9:32:29 AM MT Al****:: chart 3 on the SPKISS page shows a sell set up - watching for follow through
11/17/2023 9:11:12 AM MT Al****:: a feature of today's market are the 2 vertical lines on the secret ->esnat72 and other charts
each of these lines can produce a vertical move in either direction
11/17/2023 6:10:55 AM MT Al****:: Good Morning visitors. Welcome to the Chaos Clinic.
The written Chaos Clinic is on the AUX page.
This site has a lot of charts,
so you may find it useful to have several of them available within your
browser. If you have a tabbed browser, you can open separate charts
in separate tabs by right clicking on any link, and selecting "open in new tab"
from the menu. The main list of site pages is at
http://daytradingforecasts.com/chartlistsec.asp
Recommended pages to watch are SPKISS, MTRainbow, and Chat.
For astro stuff, add SPSunMoon, Wheel, and Chaos Clinic.
A special set of Dr. Al's research charts are on the Secret page.
Comments in the chat room are announced by a
"duck call" noise. This noise also occurs when the software detects a
resonant hex pattern on the Wheel page. MoonTide trading tutorials
are on the right side of the ListOfCharts page. One should
read Trading the MoonTide Tutorial and Keep it Simple as a minimum.
Many subscribers do not strictly trade the MoonTides, but use the charts on this
site as input to their own trading strategies. For example, charts 5 and 6 on the
SPKiss page are a good starting point for swing traders.
Also on this site is the Certified Chaos Trader's Room. That room is open
to graduates of my 4 main courses. See http://moneytide.com -> Courses for details.
11/17/2023 5:35:51 AM MT oag****:: Good morning everyone! Hope everyone has a prosperous day!
9:00 Eastern-System: No comments