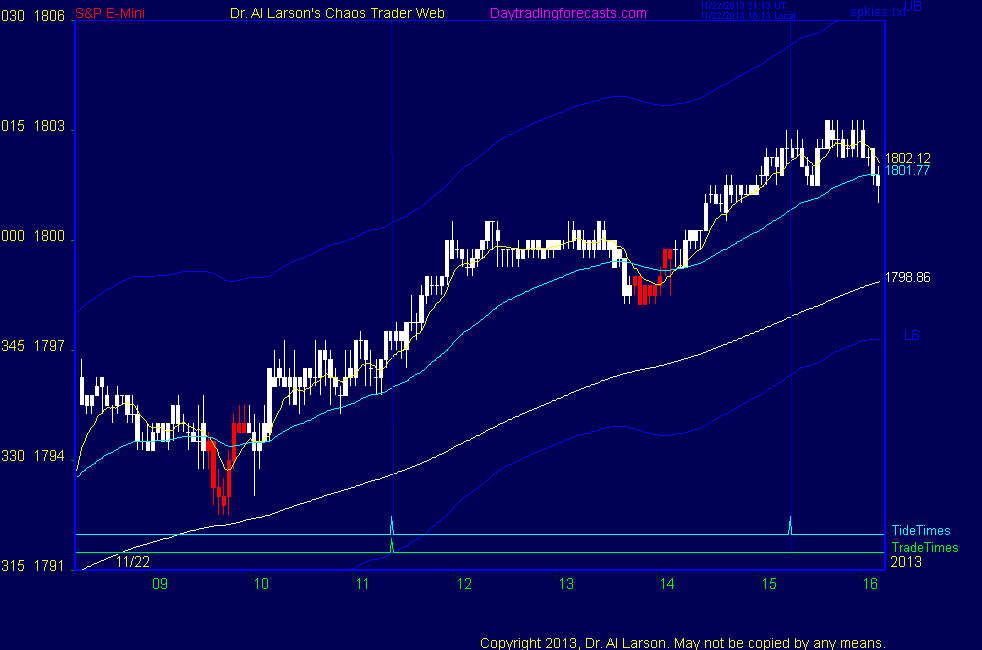


12:51 I'm done for the day-thanks for coming-have a great weekend; next clinic in two weeks. Take some courses.
12:49 covering 1799.75 on the stall
12:47 stop to 1798.75 - lock .5
12:45 on AUX chart Tide Tracker is curling over
12:40 lowering my cover order to 1800.5
12:38 stop to 1798.5
12:30 putting a sell limit in at 1801, one tick short of a harmonic 9 point range
12:29 on AUX chart top is at the R10/R4 SR pair
12:16 on the AUX page I have shifted the yellow MoonTide right 2 hours - in my research I'm
studying how the T9 et all timelines time shift the MoonTides
12:12 ate fast - stop to 1798.25
12:02 stop to 1798 - taking a breakfast break
11:57 stop to 1797.5
11:53 on the Aux page, the low was on R12 - next R12 is at 1801.25
11:52 regular BBB is laughing all the way to the bank :) - well done
11:48 updated my Face of God chart in the CCT room
11:42 TideTracker says now out of phase with the MoonTide on Aux chart
11:42 bought 98.25 stop 97
11:37 nicked out on my stop-it was too close ; and my sell was early
11:36 I have placed a Face of God chart in the Certified Chaos Trader's Room. That room is open
to graduates of my 4 main courses. See http://moneytide.com -> Courses for details.
eMylar Fractal of Pi overlays help you be patient, since they show you future potential moves.
The best bargain in my courses is to take the Cash In On Chaos and Fractal of Pi courses and
learn to use the FOP overlay. Then take Chaos Trading Made Easy, and finish with Face Of God.
11:31 sold 97 stop 98.5
11:29 OK, the only way I see to trade this is using the AUX chart
11:24 at exact trade time - making new high
11:20 not enough juice for standard hotline EXMA rules
11:14 on AUX chart, Tide Tracker show in phase with yellow MoonTide
11:05 the R5 level is a harmonic 6 point range for the day
11:02 back up to the R2/R3
10:55 so far this looks like a pre holiday session -narrow range, no juice
10:45 tested and failed the R2/R3 level on AUX chart
10:33 looks like prices will hold up into trade time but may congest along the R9 level
10:20 broke above the R9 level, but stopped at the R2/R3 pair for now
10:13 it looks like they have; the TideTracker now shows back in phase with the yellow Moontide on AUX page
9:49 I suspect that this dip passing the T9 timeline will hold prices up into our trade time
9:44 prices broke below that at the timeline. The cyan TideTracker line shows prices are out of phase with the yellow Moontide
this is the same as the red -Tide on my other charts - seems to be the dominate one most of the time
9:42 it also shows congestion about the R6,R7, R11 triplet
9:38 that chart shows a T9 timeline, which looks to have set the high at the R9 resistance level
9:31 I'm running one of my new research charts on the AUX page
9:27 I'm excited, though, because my chart generating scripts on my new server ran as designed and the network has behaved
9:24 There is only one trade time today, at 11:24; range of the last 14 hours is under 6 points, so may be too dead to trade
9:23 Good Morning. Welcome to the Chaos Clinic. This site has a lot of charts,
so you may find it useful to have several of them available within your
browser. If you have a tabbed browser, you can open separate charts
in separate tabs by right clicking on any link, and selecting "open in new tab"
from the menu. The main list of site pages is at
http://daytradingforecasts.com/chartlistsec.asp
Recommended pages to watch are SPKISS, MTRainbow, and Chat.
For astro stuff, add SPSunMoonMer, Wheel, and Chaos Clinic.
Chaos clinic comments appear at the bottom of the SPKISS, MTRainbow,
and ChaosClinic pages. Comments in the chat room are announced by a
"duck call" noise. This noise also occurs when the sofware detects a
resonant hex pattern on the Wheel page. Trading tutorials
are on the right side of the ListOfCharts page. One should
read Trading the MoonTide Tutorial and Keep it Simple as a minimum.
9:00 Eastern-System: No comments