![]()
![]()
********************************************************************************
S&P Vibrations
Chaos Clinic for 12/01/2023
********************************************************************************
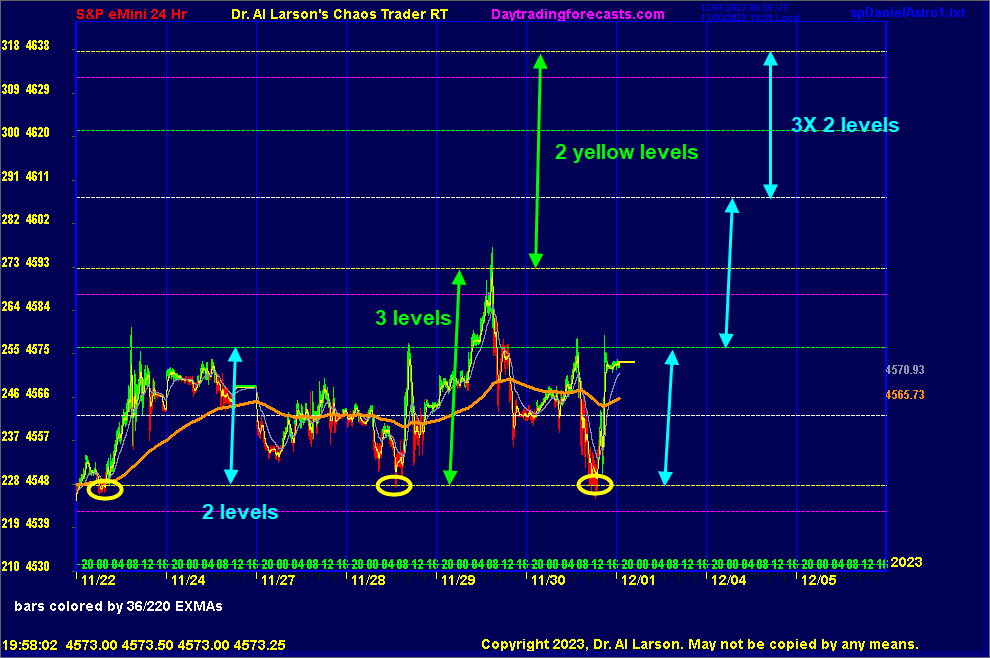
This chart shows the S&P futures for 11/23-30/2023. On the chart are horizontal
natural vibration lines, taken from the Secret->esnat72 chart on daytradingforecasts.com.
The main white, green, and yellow lines are about 15 degrees apart. They repeat every 45
points or degrees. A circle has 24 of these divisions, just as our day has 24 hours.
Also shown on the chart is a tan 2400 minute EXMA. The grey EXMA is the 220 minute.
All energy systems work off of harmonic energy levels. Each stock or commodity have these
levels, established on the first trade date. Watching these levels can be profitable.
By most accounts, this last week in the S&P has been flat, directionless, and boring.
But watching the vibration levels is informative. On 11/22 prices started a rally off the yellow level
which was also the 2400 minute EXMA. The rally went up 2 levels, to the green.
The next two trading days were Black Friday, and Cyber Monday, when apparently all the
trading was in consumer markets, Note the 2400 EXMA followed the white vibration level.
On the 28th, prices tested the yellow level, making a 4 trading day double bottom. That triggered
a fast move up to the green level. There it was sold hard. But this retrace did not reach the yellow
level and ended the day above the white and the 2400 minute EXMA. This suggested higher prices.
The rally on 11/29 expanded the 2 level range to 3 levels, up to the yellow level. This 2:3 ratio is the basis
of the musical scale, so I watch it closely. It was obvious as prices fell back 2 levels.
On the 30th, prices rallied one level, then dropped two, making a triple bottom on the yellow.
This was a tradable triple bottom setup. By the end of the day, prices had rallied two levels.
So where from here? The 2400 EXMA has shifted higher, suggesting more rally. The vibration pattern
so far has shown 2:1 and 3:2 ratios. A doubling of the 3 level range would reach 4638. A tripling
of the 2 level would also reach 4638. It seems possible, but could take another week. We shall see.
For more on my work and to subscribe to Tomorrow's Market Email Hotline and access to daytradingforecasts.com see
Moneytide.com
Software to plot electric field flux lines in NinjaTrader is available at
energyfieldtrading.com
12/1/2023 11:30:34 AM MT Al****:: I:'m going to call it a day -thanks for coming-see you next week-take some courses
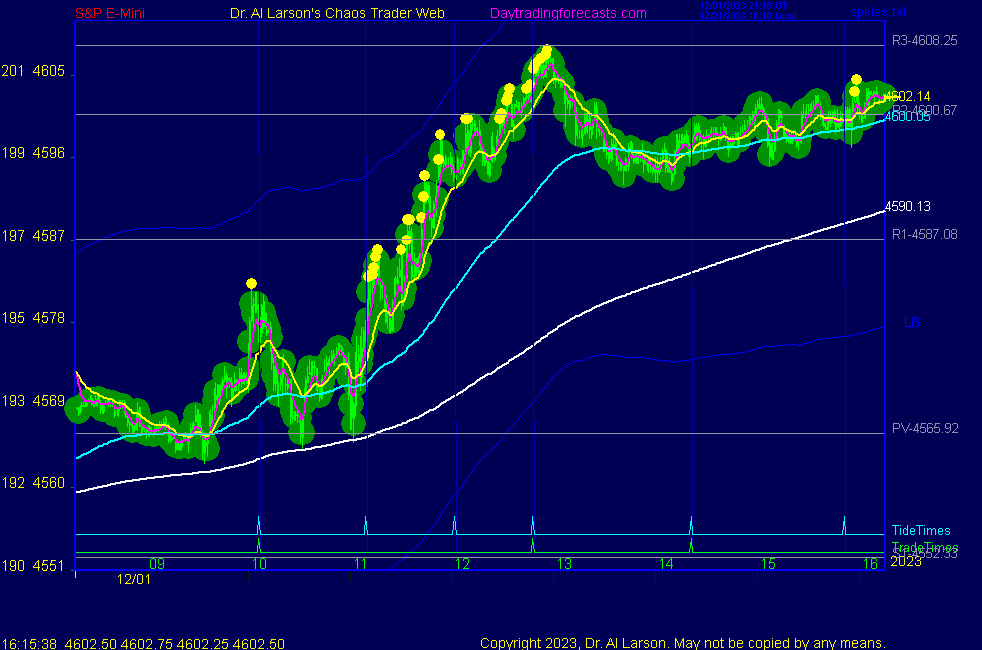
12/1/2023 11:05:24 AM MT Al****:: this is also the second trade time, a possible turn
I took profits 4605 up from 4577
may be more but I'm also watching the vertical lines on Secret->esnat72
12/1/2023 10:56:39 AM MT Al****:: up to the second white level, a doubling of the 2 level range
12/1/2023 10:33:30 AM MT Al****:: the rainbow of EXMAs is sharply up - pullbacks are not reaching my 55 minute EXMA so I'm using the 110 as my stop guide
12/1/2023 10:08:07 AM MT Al****:: a 90 degree move to +Vh180 would take prices to about 4640
12/1/2023 10:00:22 AM MT Al****:: that Venus support is what made me think prices would move up
12/1/2023 9:57:36 AM MT Al****:: at yesterday's low, the third of the triple bottom, prices
bounced off the Venus +Vh090 electric field flux
12/1/2023 9:49:21 AM MT Al****:: today's Mercury + and - flux are very close due to a crossover just after the close just after the close
4567.5 was the mean of the +Mh270 and -Mh135 flux
the next set up is 4612.5
12/1/2023 9:44:59 AM MT Al****:: Mars timeline adding energy
12/1/2023 9:27:37 AM MT Al****:: today's pullback was to the white level on Secret->esnat72
a pullback of one level
may get a 2 or 3 level rally
12/1/2023 9:14:46 AM MT Al****:: chart 3 on SPKISS showed a nice continuation buy on first trade
12/1/2023 6:32:15 AM MT Al****:: Good Morning visitors. Welcome to the Chaos Clinic.
The written Chaos Clinic is on the AUX page.
This site has a lot of charts,
so you may find it useful to have several of them available within your
browser. If you have a tabbed browser, you can open separate charts
in separate tabs by right clicking on any link, and selecting "open in new tab"
from the menu. The main list of site pages is at
http://daytradingforecasts.com/chartlistsec.asp
Recommended pages to watch are SPKISS, MTRainbow, and Chat.
For astro stuff, add SPSunMoon, Wheel, and Chaos Clinic.
A special set of Dr. Al's research charts are on the Secret page.
Comments in the chat room are announced by a
"duck call" noise. This noise also occurs when the software detects a
resonant hex pattern on the Wheel page. MoonTide trading tutorials
are on the right side of the ListOfCharts page. One should
read Trading the MoonTide Tutorial and Keep it Simple as a minimum.
Many subscribers do not strictly trade the MoonTides, but use the charts on this
site as input to their own trading strategies. For example, charts 5 and 6 on the
SPKiss page are a good starting point for swing traders.
Also on this site is the Certified Chaos Trader's Room. That room is open
to graduates of my 4 main courses. See http://moneytide.com -> Courses for details.
12/1/2023 5:31:18 AM MT oag****:: Good morning everyone! Hope everyone has a prosperous day!
9:00 Eastern-System: No comments
![]()
![]()