********************************************************************************
A Great Two Moon Day, Eclipse Season, and Omicron
Chaos Clinic for 12/03/2021
********************************************************************************
One of the more useful tendencies that show up in the S&P futures is what I call
a "Two Moon Day." These are days when the rotating Earth rotates the NYSE past one
of the Moon 0, 90, 180, or 270 times near the normal session open and close.
The tendency on these days is: "These days are often volatile, and run Moon to Moon.
or Moon-Noon-Moon." This comment was part of the nightly email from Daytradingforecasts.com
for the 12/1/2021 session.
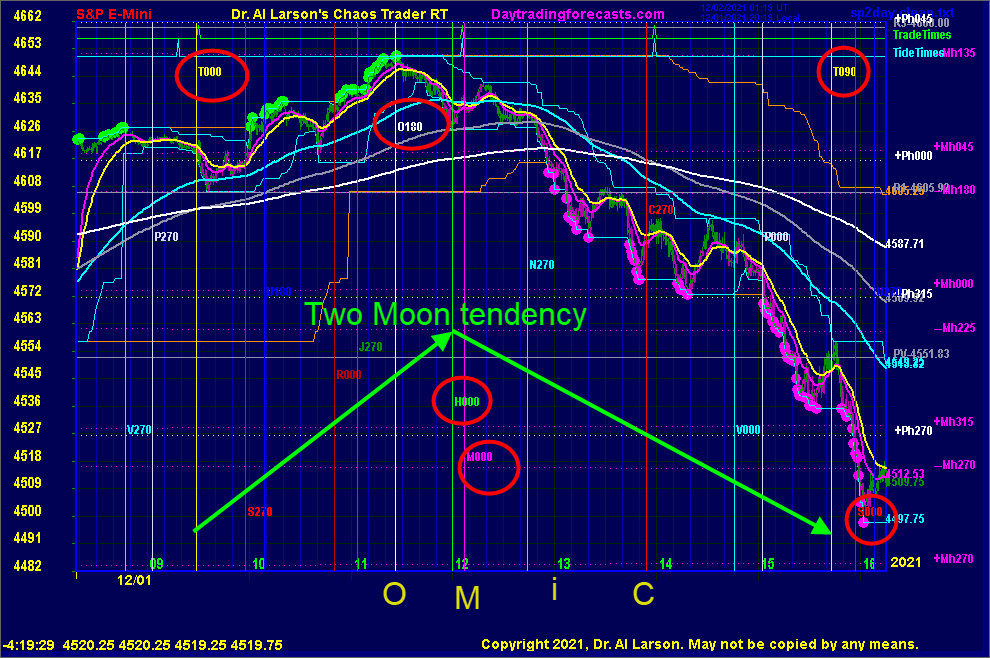
This chart show the details of that session. Shown on the chart are prices
from 08:00 to 16:15 Eastern. Vertical lines mark the times the Exchange rotates
past various planets, with the aspects. On this day, the Moon T000 timeline occurred
right on the 09:30 normal session open. Prices were pretty flat, but rallied after the
Saturn S270 timeline. At that point, a move up to the Sun H000 or MoonT090 timeline
would be the expected tendency.The rainbow of EXMAs show this: The magenta one is a
15 minute, the yellow a 20 minute, the cyan is 110 minutes, the gray is 220 minutes,
and the white is the 440 minute. Also shown are green and magenta "push balls",
showing where prices are pushing higher or lower.
Two types of horizontal support/resistance lines are shown. The magenta lines are
Mercury heliocentric electric field flux lines. The white ones are Pluto helio flux.
The gray levels are pit price support and resistance levels computed from the
prior days prices. On this day, the R1 level coincided with the -Mh180 flux,
and provided support for the early dip.
The early rally progressed well, until it hit the +Mh135 flux and the Node O180 timeline.
As explained on my 11/19/2021 Chaos Clinic. "How The Lunar Eclipse Showed Up Early In The S&P ",
The Moon, Node, and Sun align to form an eclipse. So in this two week period between the
11/19 lunar eclipse and the 12/4 solar eclipse these timelines have been important.
Further, as pointed out in that Chaos Clinic, the Mercury timeline coming just
ahead of the Sun sent prices higher going into the lunar eclipse.
So when prices dropped from the Node O180 timeline, I watched to see the effect of the Sun timeline.
I noted that now the Mercury timeline was after the Sun. The second MoonTide trade time
was exactly on the Mercury timeline. That alerted me to the possibility of a Moon-Noon-Moon
move. When the 20 minute EXMA crossed the 110 I sold at 4634.
Before the hour was out, the 110, 220, and 440 EXMAs turned down. At that point I hoped
the down to the Moon tendency would hold. I carefully trailed my stop above the 440 EXMA.
From experience with Two Moon days. I resolved to hold into the close.
That turned out to be wise, since prices dropped even more after the Moon T090
timeline, along the Saturn S270 timeline. I covered my trade for a shade over 120 points.
What I was not aware of was that news of the Omicron COVID variant had been spread on news channels.
My belief is that all events are in the energy field first, so not watching the news constantly
is not necessary.
I learned from my mentor, Ev Garrett, that the
Hebrew sages have for centuries taught that "God speaks to us through the planets." So
it was interesting to me to note that the timelines in the center of the chart are
ROMNC. Rearranging them gives OM-CR-N. I use I for the Moon's inclination. At the
lunar eclipse it was at 0, so it is part of "the code." Then if I use O twice
I get OMICRON. Far fetched? Maybe, maybe not.
For more on my work and to subscribe to Tomorrow's Market Email Hotline and access to daytradingforecasts.com see
Moneytide.com
Software to plot electric field flux lines in NinjaTrader is available at
energyfieldtrading.com

12/3/2021 11:07:56 AM MT raf:: I see the tide tracker white line is running flat.
12/3/2021 10:57:51 AM MT Al****:: the volatility had died down and I'm tired, so I'm going to call it
quits for today. One 60 pointer is enough for me. Thanks for coming. Take some courses. See you next week.
12/3/2021 10:24:52 AM MT Al****:: even though the solar eclipse is tomorrow, the electric field
is forming it today
solar eclipses are conjunctions of Sun and Moon, so tend to be lows
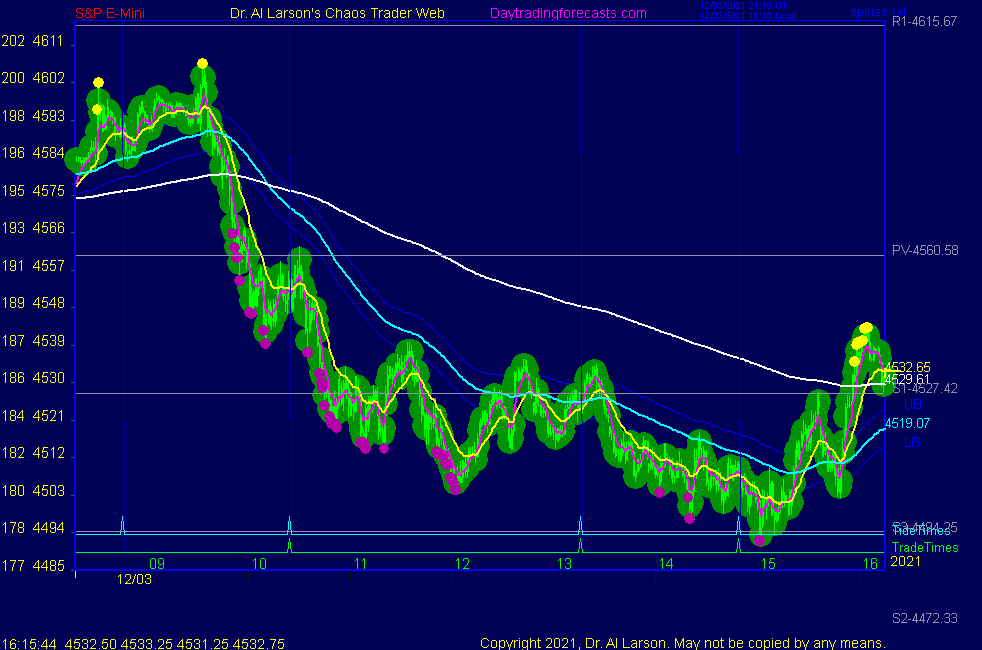
12/3/2021 10:17:00 AM MT Al****:: a 3 day 30 minute chart is showing a triple bottom
got a low on Sun timeline and up energy on Mercury timeline
12/3/2021 9:33:45 AM MT Al****:: finally chart 5 on SPKISS show 3 lows, each higher with some Moon flux support -not a low I'd buy but one to respect
12/3/2021 9:28:18 AM MT Al****:: the other reason I covered is the cluster of timelines here-on the SPSunMoon chart you see Moon T000. O180, H000, M000
these can change things so best to be a watcher
12/3/2021 9:26:45 AM MT raf:: Congratulations Al on another positive side trade.
12/3/2021 9:24:10 AM MT Al****:: I've learned to take it while I've go it in the S&P
one reason I covered is the vertical white line on the
Secret->esnat72 chart
It is the first of 3 vertical lines, which I call "confusion lines"
because I often get confused by them - so I took prifits before getting confused :)
12/3/2021 9:19:06 AM MT Al****:: that's +60 . which is fine for a day trade - I used just one MES contract at $5 a point.
12/3/2021 9:15:53 AM MT Al****:: that is 90 degrees , an extreme move, so I'm covering 4528
12/3/2021 9:08:21 AM MT Al****:: note on esnat72 the white vibration levels - down 2 levels
12/3/2021 9:06:08 AM MT Al****:: back from breakfast -prices down to S1 -stop to 4548
12/3/2021 7:58:58 AM MT Al****:: put my stop in at 4583 and going to breakfast
12/3/2021 7:56:50 AM MT Al****:: I was also watching Secret->esnat72 vibration levels - fell short of white vibe by a hair
12/3/2021 7:55:16 AM MT Al****:: I did that on chart 4 on the SPKISS page:
note the isolated yellow pushballs on the employment report and the outcry open
12/3/2021 7:50:02 AM MT Al****:: not sure if it will work out, but sold 4586
12/3/2021 7:45:45 AM MT Al****:: Chart 3 on the SPKISS pages shows an up fractal, which could be ending
things change when the normal session opens and real volume comes in
12/3/2021 7:44:45 AM MT CTB:: Hi everyone
12/3/2021 7:42:45 AM MT Al****:: today is First Friday, when the employment report is released at 8:30 Eastern. Today's report was lower than expected and trading of it was tepid
12/3/2021 7:02:09 AM MT Al****:: Good Morning visitors. Welcome to the Chaos Clinic.
The written Chaos Clinic is on the AUX page.
This site has a lot of charts,
so you may find it useful to have several of them available within your
browser. If you have a tabbed browser, you can open separate charts
in separate tabs by right clicking on any link, and selecting "open in new tab"
from the menu. The main list of site pages is at
http://daytradingforecasts.com/chartlistsec.asp
Recommended pages to watch are SPKISS, MTRainbow, and Chat.
For astro stuff, add SPSunMoon, Wheel, and Chaos Clinic.
A special set of Dr. Al's research charts are on the Secret page.
Comments in the chat room are announced by a
"duck call" noise. This noise also occurs when the software detects a
resonant hex pattern on the Wheel page. MoonTide trading tutorials
are on the right side of the ListOfCharts page. One should
read Trading the MoonTide Tutorial and Keep it Simple as a minimum.
Many subscribers do not strictly trade the MoonTides, but use the charts on this
site as input to their own trading strategies. For example, charts 5 and 6 on the
SPKiss page are a good starting point for swing traders.
Also on this site is the Certified Chaos Trader's Room. That room is open
to graduates of my 4 main courses. See http://moneytide.com -> Courses for details.
12/3/2021 6:50:16 AM MT Jam:: hello It's my first visit to the chat room
9:00 Eastern-System: No comments