![]()
![]()
********************************************************************************
Astro Energy Rockets S&P
Chaos Clinic for 12/15/2023
********************************************************************************
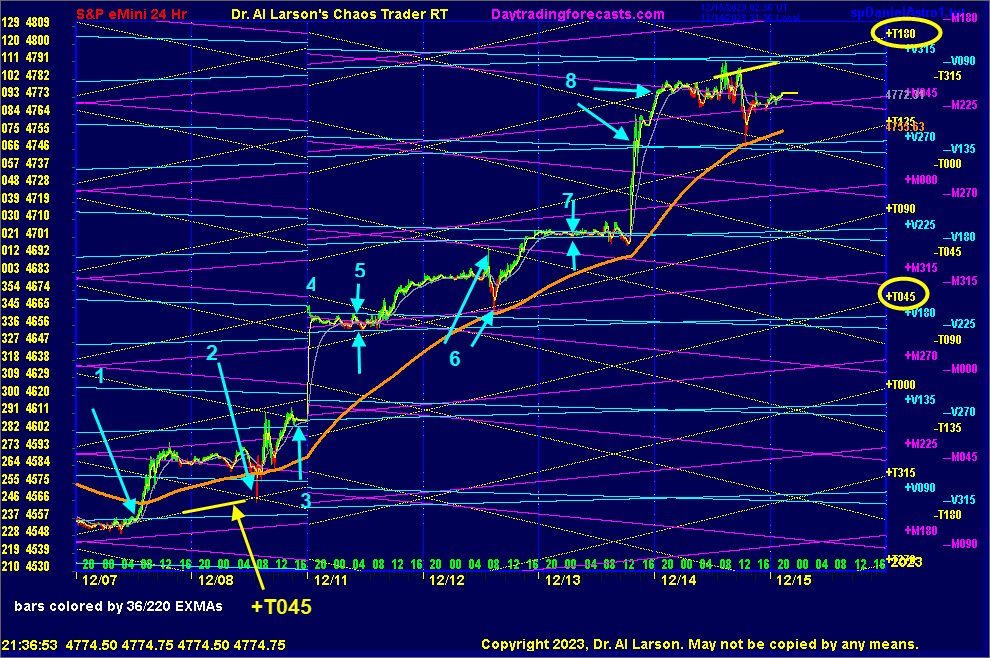
This chart shows the S&P futures for 11/07-15/2023. During this period the
S&P futures rallied over 5 percent. The chart shows the electric field flux lines
for the Moon, Mercury helio, and Venus helio. The brown EXMA is the 2400 minute.
The grey EXMA is the 220. Bars are colored by the 36/220 minute EXMA. During
this rally, several astro events aided the rally.
The rally began at point 1 as the Moon +T045 flux moved up to cross the Venus +V1090 flux.
The daily move was strong, "leaning up" into the Employment Report on the 8th. At point 2
The report created wild action, bottoming on the Moon +T045. By the close at point 3 prices
were above the Venus +V315 flux. This suggested a higher week ahead. But there was a
practical trading problem. On Monday the 11th, trade switched to the March 2024 contract.
So one had to see how that looked before trading.
When trading resumed on the 11th, at point 4, the new contract was 60 points (1/6th of a circle)
higher than the old. this meant traders were willing to pay a 1.3 per cent time premium
for the new contract. That indicated a bullish sentiment.
Monday the 11th saw prices trapped between two Venus flux (point 5), as they navigated a Mercury
flux crossover This congestion was above the Moon +T090 flux, indicating the new
contract was trading harmonically 1/8 of a circle above the old. That and the up 2400
suggested buying here on a swing trade as the market "leaned up" into the CPI
report on the 12th. A move up another 90 degrees looked probable.
The two arrows at 6 show the "twang" produced by the CPI report as it popped up to the -T090
down Moon flux, then down to the +T090 Moon and +M135 Mercury flux just above the up 2400 EXMA.
The rally into the close was strong, up to the +V225 flux. This "leaning up" into the
FOMC announcement let me hold my buy from the 11th at 4660 with a stop at 4683.
The market was totally flat on the morning of the 13th, waiting for the FOMC announcement. Point 7
shows that this flat was produced by the +V225 and -V180 flux. At that point prices
going up another 45 degrees was highly probable.
When the FOMC announcement came, prices shot up. Point 8 shows the jump up to the
+Vh270, which is where my 4746 cover was. The rally was not over, reaching the Moon +T180 flux
after the normal session.
While these economic reports get the credit for lifting prices, one can clearly
see that the electric field provides the energy for the moves, and harmonic energy
addition sets the key levels.
For more on my work and to subscribe to Tomorrow's Market Email Hotline and access to daytradingforecasts.com see
Moneytide.com
Software to plot electric field flux lines in NinjaTrader is available at
energyfieldtrading.com
12/15/2023 12:39:54 PM MT Al****:: I'm done. Thanks for coming. have a great weekend.See you next week. take some courses.
12/15/2023 12:36:19 PM MT Al****:: covered here based on 7 swings down in 20 min EXMA
glad you got some qq
12/15/2023 12:23:21 PM MT qq:: Thanks Al. I was able to get a slice of that pie.
12/15/2023 11:40:58 AM MT Al****:: continuation sell at Moontide trade time
12/15/2023 11:07:20 AM MT Al****:: that's the extreme possibility
another is 4755 +T135
12/15/2023 11:00:13 AM MT Al****:: possible drop to 4740 Moon -T000
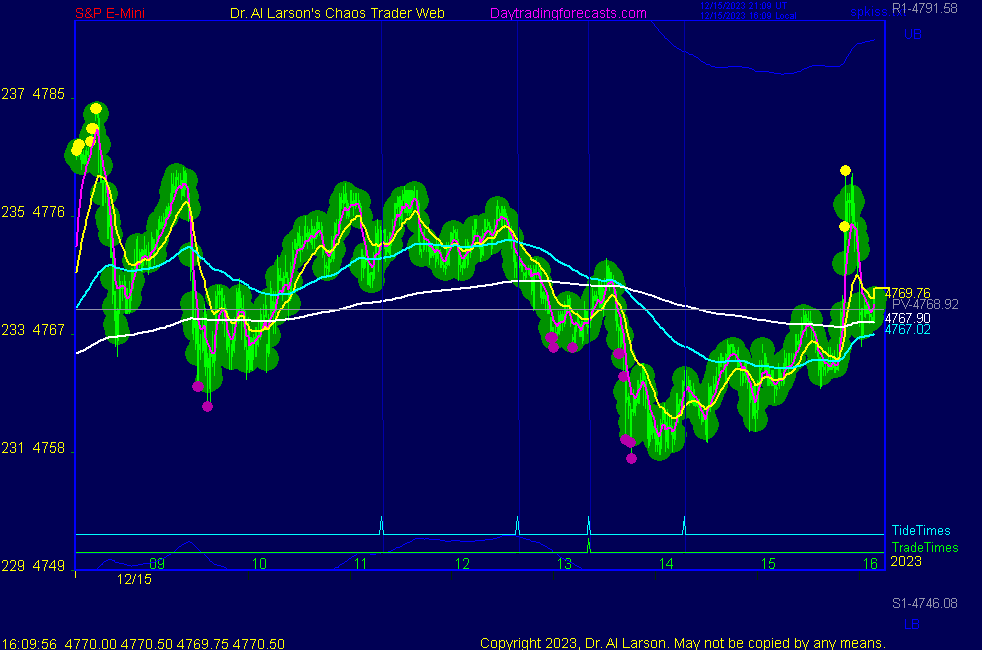
12/15/2023 10:48:07 AM MT Al****:: running a live flux line chart in the CCT Room as cctchart3
12/15/2023 9:51:57 AM MT Al****:: also near that time there are two vertical lines on the Secret charts
12/15/2023 9:44:16 AM MT Al****:: This is a slow distribution pattern under yesterday's high. Such
patterns on Friday often hold up until 14:00, then drop.
Today the Moon T000 and Pluto P000 timelines are near 14:00
12/15/2023 6:46:49 AM MT Al****:: Good Morning visitors. Welcome to the Chaos Clinic.
The written Chaos Clinic is on the AUX page.
This site has a lot of charts,
so you may find it useful to have several of them available within your
browser. If you have a tabbed browser, you can open separate charts
in separate tabs by right clicking on any link, and selecting "open in new tab"
from the menu. The main list of site pages is at
http://daytradingforecasts.com/chartlistsec.asp
Recommended pages to watch are SPKISS, MTRainbow, and Chat.
For astro stuff, add SPSunMoon, Wheel, and Chaos Clinic.
A special set of Dr. Al's research charts are on the Secret page.
Comments in the chat room are announced by a
"duck call" noise. This noise also occurs when the software detects a
resonant hex pattern on the Wheel page. MoonTide trading tutorials
are on the right side of the ListOfCharts page. One should
read Trading the MoonTide Tutorial and Keep it Simple as a minimum.
Many subscribers do not strictly trade the MoonTides, but use the charts on this
site as input to their own trading strategies. For example, charts 5 and 6 on the
SPKiss page are a good starting point for swing traders.
Also on this site is the Certified Chaos Trader's Room. That room is open
to graduates of my 4 main courses. See http://moneytide.com -> Courses for details.
12/15/2023 5:34:34 AM MT oag****:: Good morning everyone! Hope everyone has a prosperous day!
9:00 Eastern-System: No comments
![]()
![]()