Cashing in on XGO
Dr. Hans Hannula, PhD, RSA, CTA

Dr. Hans Hannula, PhD, RSA, CTA
As a researcher, I constantly think, ponder, and theorize about why markets move the way they do. Over the years, I have learned more and more about the mysterious forces that move markets, ourselves, and the universe. One of the problems I have pondered is "How predictable are markets?" Many say markets cannot be predicted at all. That is the random walk theory. Some have claimed that they could perfectly predict markets. That's the deterministic theory.
I have found that neither works. What does work is
So another question I have pondered long and hard is "How can
markets be predicted within a domain of behavior?" My approach
has been to seek out the physical laws that move prices, similar to
the laws of physics that move balls dropped in bowls. Through painstaking
research I have found that there are forces that move prices, physical
forces. The source and patterns of these forces were revealed in
my Face Of God course. That was a major step forward. I could
see the forces operating and the resulting behavior, but still
I pondered.
I asked "What is the mathematical relationship between those forces
and price action?" If I could find the answer to that question,
I could predict future price action, at least within domains. I needed
an new insight.
Such an insight came to me the morning of January 23rd, 1996. As
I awoke, an idea came that said,
"It's energy absorbion. Compute the energy being absorbed
from the universe, and it will tell you where prices are going, for
prices are energy."
That insight became the XGO program, because for any market
X, it computes where that market will GO. Incredibly,
it computes this from only one piece of information - the date of
first trade. Price energy is computed for any future date after that.
No past prices are ever used. None are needed. Just one formula.
Very simple.
At first it may seem incredible that this can be done. But it is
really not. If one understands the equations of motion of a ballistic
body, such as an arrow shot into the air, one can compute its flight
path. One simply needs the formula, and the launch data, such as
weight of the arrow, the initial angle, the velocity, and the acceleration. From
there it is "plug in the numbers and turn the crank." XGO, in a similar
manner, computes the "energy flight path" of a market launched into
the universe.
The XGO formula captures the harmony of energy flow from the universe
into a stock, a commodity, or a person. It translates the graphical
beauty and power seen in
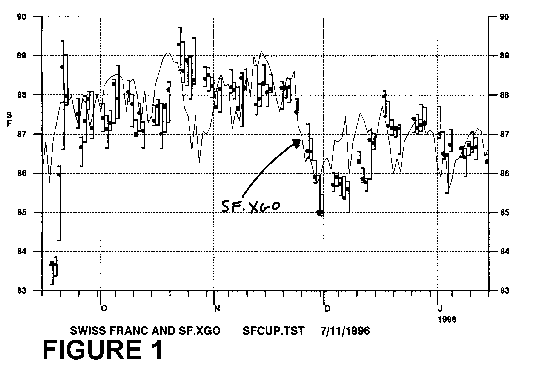
Figure 1 is a chart of the Swiss Franc and its XGO forecast. The
thin line is the XGO forecast. Notice how accurately it drew the price
line in advance. Note the day to day detail. And the fine timing
of highs and lows. Pretty impressive, huh? Almost perfect.
Not statistically perfect. Just good. There is a statistical
measure of how well a forecast matches reality, called the correlation
coefficient. A perfect forecast is 1.0. A total failure is 0. Most
forecasts fall in between. Experience in evaluating intraday neural
net forecasts used in real trading has led to the following interpretation
of the correlation coefficient:
below .3 - useless for trading
.4 - helpful
.5 - decent
.6 - good
.7 - great
over .8 - excellent
We have found that the correlation coefficient is a very harsh judge
of forecasts. The 10 billion neuron neural net (brain) between a trader's
ears picks up things from the forecast that are not reflected in the
correlation coefficient. Traders using technical analysis and a .5
or better forecast consistently make money. One trader I've worked
with uses intraday forecasts that average .45. He wins on every 2
out of 3 trades, and makes $1.83 for every $1.00 he loses. So even
a decent forecast can give one an edge in the markets.
So how good is that Swiss Franc XGO forecast? It computes to .61,
a solid GOOD. Not bad for something using no price data. Such
is the power of a fundamental theoretical approach.
XGO is not a perfect model of prices. It only computes the energy
input to a market. The market uses that input and its own internal
properties to produce the price output. For example, there are points
in time when a market is at a chaos balance point. The ball
is on the rim between the bowls.
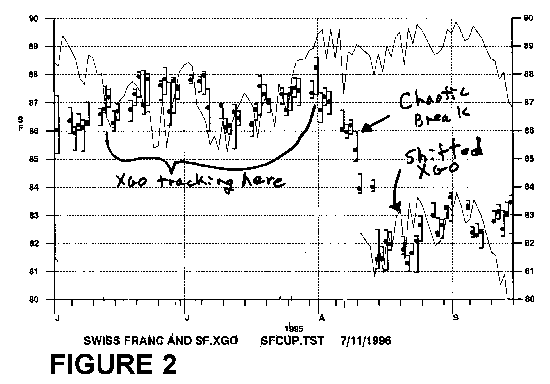
At those points, a sharp break may occur and prices move much further
that XGO predicts. This is a "quantum shift", or "band
gap jump." Such breaks may temporarily give XGO a bad correlation
coefficient, but the trading value of the forecast continues. After
the quantum shift, prices return to following the XGO curve if it
is simply shifted up or down. Figure 2 shows this situation.
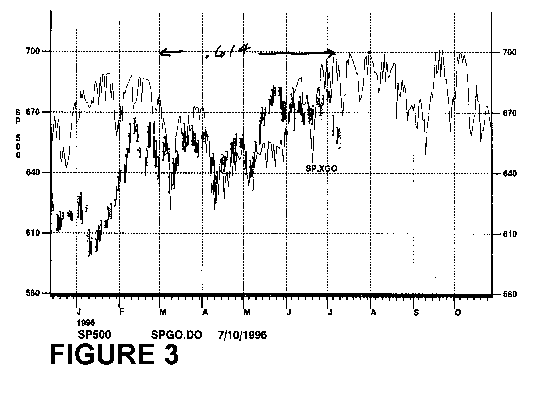
Everyone wants to know about the stock market. Where is it going? Figure
3 shows the S&P 500 XGO forecast for the first part of 1996. Notice
how well it has forecast the turns, especially those spike lows. For
years I have worked on annual forecast methods. XGO tops them all. From
February to early July, that forecast is a .614, a solid GOOD.
So can XGO really help your trading? The way to answer this is to
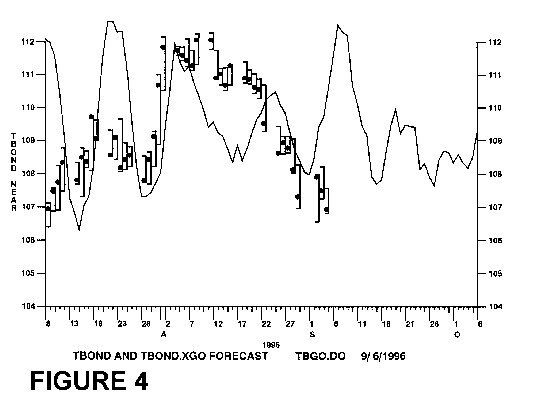
look at an example. Figure 4 shows Tbonds, and the XGO function for
bonds. Notice that while the forecast is not perfect, that it is
pretty good. There are areas where the forecast does not work well. So
to protect oneself from those times of poor forecast, one has to use
trading rules. We have found these rules effective.
1. Make all entries and exits with stop orders.
2. Trade in the direction of XGO
3. Protect positions with a stop that trails XGO
Tbonds have been included in our hotline and newsletter position trading
portfolio for nearly 5 years. We felt bonds were a key component
of a balanced portfolio. But the trading results were not pleasing. They
weren't bad-just not great. For four years we would win some money,
then give it back. As shown in Figure 5, our equity moved about Zero,
plus or minus $4000. That portion of our portfolio was stuck in a
trading range.
XGO changed that. Since applying XGO to this market, we've broken
out of the trading range and established a nice trend. Be advised
that past results do not guarantee future results, and that trading
futures is risky.
We have found that the key to reducing that risk is a constant search
for new technology. XGO is a part of that technology. It is making
a difference in our results.
So I have learned that markets can be predicted, at least within
the limits of chaos theory. XGO has been a valuable addition to
my trading toolbox. Used carefully, it can give one a trading edge.
Over the several months since it came to me, I have learned that XGO
is real. The equation is valid. It works. It is
not perfect, but it is excellent. It is on the cutting edge. XGO is
the state of the art.
Mathematical Evaluation


Market Evaluation


XGO Helps
XGO is one component in a growing set of market tools under
development at MicroMedia. One can learn more by contacting the author
or checking out his WEB site at http://www.cashinonchaos.com/hans.
For your own XGO chart for one year, send $36 and your date of birth
to MicroMedia, Box 33071, Northglenn CO 80241, or fax to 303 457 98713
To place your order for your own XGO chart,
click here.
To see a list of our other products, click here.
![]()
![]()