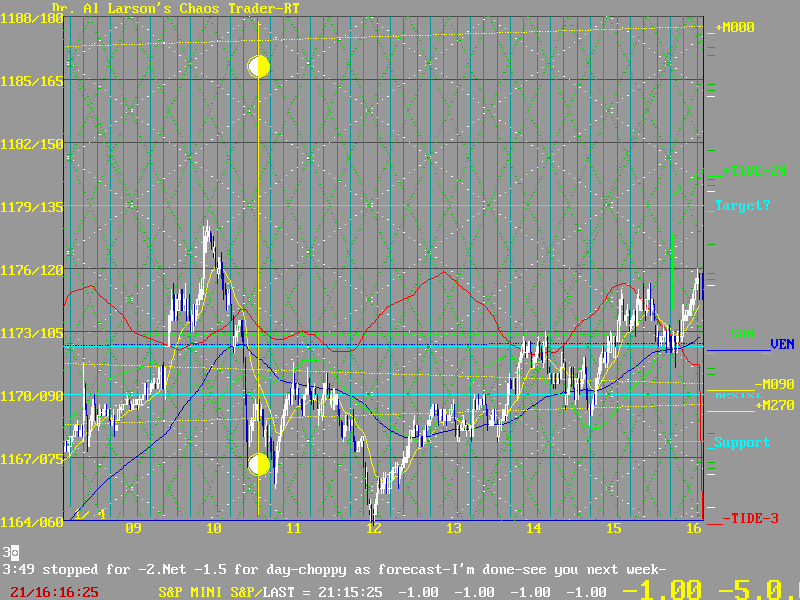

Chaos Clinic from 01/04/2002
This is the chart

These are the comments made during the live session
3
3:49 stopped for -2.Net -1.5 for day-choppy as forecast-I'm done-see you next week-___________________________
3:47 bought 1174 stop 1172 -needs to rally now_____________________________________________
3:40 10:00, and 12:00 were hot, 4:00 will be too.__________________________________________
3:31 bought 1174 stop 1172-hold-possible closing move-small risk____________________________
3:22 Green minor grid line is supporting trend line for this fast rally-hold and wait________
3:12 broke out of the range-buy 1174 stop 1172________________________________________________
3:08 looks like inverted to Red -Tide - Still in trading range- put a sell stop at 1171.5_____
3:05 It also helped that I knew there was a Venus/Moon cycle at 3:23, making the Venus flux hot_
3:02 good cover-cannot hesitate-I covered when it broke 1170,then came back above_________________
2:54 trade not moving-cover 1170.5 for 0 gain___________________________________________
2:48 Broke below 1170-can lower stop to 1172.50,1 tick above top of diamond-sold 1170.5__
2:39 sold 1170.50 stop 1173.50-lower to 1173__can press closer just after 3:00________
2:33 got another down draft-green tide says hold short-shifted red tide say MAYBE______
2:28 IF the red tide shifts left, it puts a vertical drop in the last hour______________
2:23 Sell 1170.50 stop 1173.50 __-I'm just reversing on the failure to break resistance__
2:20 stopped for -1. I used the grid to tell me when to press that stop-at the corner___
2:12 bought 1172, raise stop 1171________________________________________________________
2:09 I labled Resist 2 at top of diamond-need to break it for trade to work________________
2:00 bought 1172, put stop 1169.75, 1 tick below bottom of diamond_________________________
1:57 stopped for -1. Note double green minor flux line-stronger than others_________________
1:55 if break above -M090 moon flux, I want to go long, so put a buy stop 1172______________________________
1:52 sold 1170 stop 1171 - just above the Moon flux ________________________________________
1:47 I added the Node flux line-note where it crosses the Moon flux at 1:57-_________________
1:43 Notice how the range has pinced down sharply-now just half a diamond-it WILL expand_____
1:35 Also put a sell stopunder support line-sell 1167.50 stop_________________________________
1:32 rallies stopped at 1170 resistance level-if hit again should try a sell,1170 OB,stop 1171_
1:25 Cancel the 1ADAY trade- been trying for over 30 minutes-I moved support line up_________
1:09 sell 1167.25 stop ______________________________________________________________________
1:04 sell 1167 stop-if hit, trail protective stop $+3. Note how white grid forms trendline___
12:54 sell 1167 stop__________________________________________________________________________
12:51 sell 1166.75 stop ______________________________________________________________________
12:47 sell 1166 stop___________________________________________________________________________
12:46 raise sell to 1165.50 - trail if rally, $-2.5____________________________________________
12:45 1Aday is to trail entry stop 2.5 under price going into 1:00 => sell 1165.25 stop _______
12:40 I adjusted the Trading range markers up half a diamond-brackets the +M270 moon flux_______
12:33 1ADay trade is to trade counter the short term trend going into 1:00--looks like a sell____
12:18 Now in a diamond that has price in both the left higher and left lower diamonds->congestion_
12:06 out for +2.5- went lower but I don't care -_______________________________________________
12:01 sold 1168 buy 1165.50 or better=bottom of diamond-stop is 1170.25_________________________
11:49 sold 1168- put stop at top of diamond+1 tick=1170.25-_____________________________________
11:42 A downtrend would mean a break into the next lower right diamond-can sell 1168 stop_______
11:35 White grid is the magor grid, green one is the minor grid-prices now trapped in a diamond_
11:33 I have marked a probable trading range centered about 1170, where the Moon flux balance____
11:22 switching to 1 day screen with S&P harmonic grid for a while________________________________
11:02 How's that for stppng slide?Trading range now set-need fast relexes to trade moves like that_
10:55 Dipped a bit more to the Saturn flux-Sat was first planet passed by Xchg-probably stop slide_
10:45 here we are at 1169 Node flux as Xchg passes Node-NOT AN ACCIDENT-but a real physical thing_
10:33 QrtMoon/Node are hot - I missed the trade - If you miss a trade-don't chase it-more coming_
10:20 Moon squares Node today at 1:57.Xchg passes Qrtr Moon and Node next.Price flux 1169____
10:02 Rally as per red -Tide-but Tide says do not chase it-Made it above Mercury flux to Neptune_
9:49 the MoonTide forecast shows a choppy day and narrow range-so trading may be hard_____________
9:38 1176 flux is Mercury-This move started on Mercury flux at 1158-so 1176 strong resistance_____
9:33 opening up, suggesting red -Tide in effect. Sun/Ven/Jup forming tight flux bundle_____________
9:10 Good Morning from the Chaos Clinic_____________________________________________________________
_______________For the new Chaos Clinic, go to Daytradingforecasts.com__________________________________________________________________________________