
The first chart shows why I think so. This chart is an overlay of the 1987 market and the 1997 market. I first received a copy of a chart showing this overlay several weeks ago. It came from Larry Pesavento of Tucson, AZ. Larry is a very experienced trader and market master, so I respect his view immensely. When I looked at his chart, he had aligned the markets using the
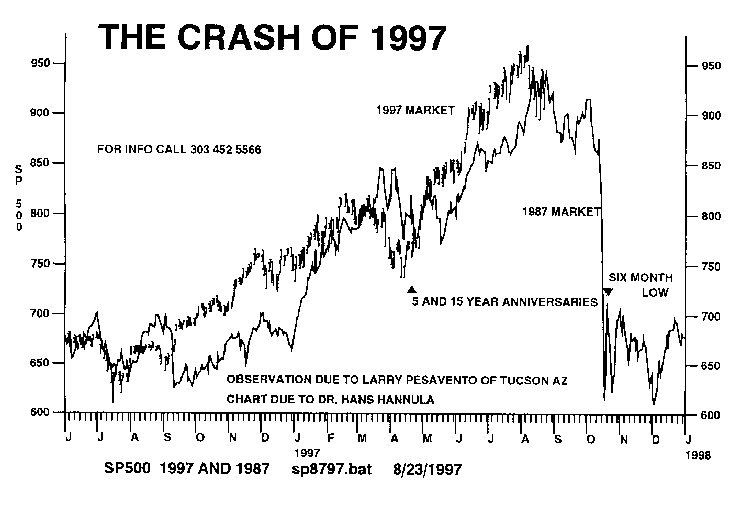
April lows. I realized that the April 21st lows in '87 and '97 marked the 5 and 15 year anniversaries of the first trade date of the S&P 500 index. That meant that the alignment was aligning natural cycles. Six months from this April anniversary date the market made a major low in 1987. It could well do so in 1997.
Many readers have enjoyed riding the immense bull market of the past few years and the participation in mutual funds, their retirement funds, and IRA's. Many of these people are entirely new to stocks and the dangers of markets. The danger is this: All the gains that you have made since 1994 could be wiped out in a few months. The market could drop 20 - 40 percent.
This is not a claim that it will happen, but a warning that it very well could happen. Prudence suggests that you immediately move your investments to the sideline until after the October/November lows.
This means pick up the phone and call the appropriate number and ask that your money be put into money market funds. Then in October or November one of two things will be clear. The drop will have occurred and there will be bargains galore or if there is no drop, the market will break above it's old highs and resume a bull market. You may safely reenter the market under either of those two conditions. Until then, get out, stay safe, and avoid the riskiest period the market has seen in the last decade.
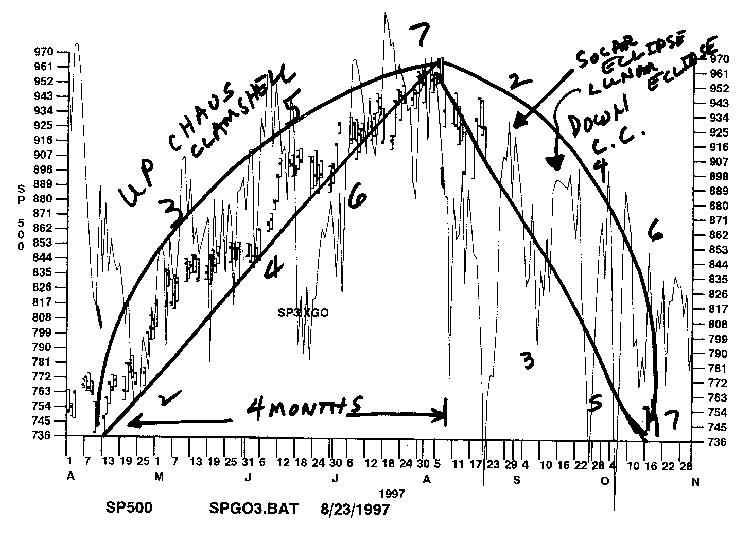
The second chart shows another reason to be bearish. Our SP3.XGO forecast is a computer calculation of the energy absorbed by the S&P 500. It shows that the market will be down into October.
This forecast has correctly called the market this year with a high degree of accuracy. It called for a top in early August and we did, indeed, get it. It is now calling for another top on the solar eclipse in early September and a third top on the lunar eclipse in mid-September. XGO is an absolutely unemotional, unbiased forecaster. It is a calculation of where a market's energies are going. XGO says the energies in stocks is going down for the next several months.
The high in August marked the end of a 4 month up Chaos Clamshell (CC). The following clamshell can be expected to last 2, 3, or 4 months.

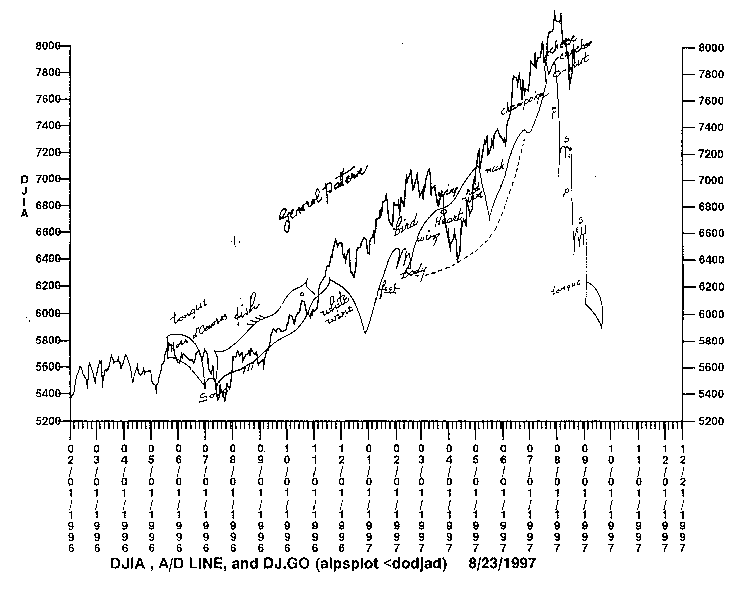
The third chart shows the 13 month Chaos Clamshell which has just been completed in the Dow Industrials. This CC is perfectly formed. It is of a type called an up-bottom CC. Up-bottom CC's, particularly those that end with a sharp, fast move 7 as this one has, are frequently followed by a rapid decline retracing at least half of the rise. That could bring the Dow down to the 6400 level or lower in a few months. Again, no guarantees that this will happen, but the experience with these Chaos Clamshells indicates that it very well could happen.
This particular up-bottom Chaos Clamshell is related to a pattern found in the 1940's by George Bayer, a famous trader. George Bayer published a book titled, The Egg of Columbus. In the 1980's it was very hard to find a copy of The Egg of Columbus. I know of one person who offered $30,000 for a copy of that material. Why is that material so valuable? Because it contained in it an exquisite description of the progression of a bull market followed by a bear market.
George Bayer described the bull market as a feast starting with hors de hors, soup, then fish, followed by white wine. Then the main course of a bird consisting of a body, wing, heart, and wing is served, followed by red wine, and the neck of the bird. This was followed by champaign, a little cheese, a cracker, and a nut.
After gorging on this fabulous feast, it is time to pass the intake through the body and output it. George Bayer describes this bear market phase with somewhat vulgar, but very descriptive terms of piss and shit with three phases followed by a final exhaustion phase of the tongue hanging out.
The original pattern as drawn by George Bayer is overlayed on the next chart.
This shows the same time period as the last chart, the overlay this time being George Bayer's Egg of Columbus pattern rather than my Chaos Clamshell pattern. The pattern fits incredibly well. It says the feast is over. Notice in particular at the top of the pattern one can clearly see the cheese, cracker, and nut formed in August as the Dow made a quick double top and then declined. Some people started to choke a little on the nut. These found the first utterings by many investors of the expletive "piss!" Next week they should be uttering the following expletive.
I believe that the universe creates incredible coincidences. It is not accidental that I happened to look at George Bayer's Egg of Columbus pattern this week. I studied George Bayer's material 8 years ago. I have scarcely looked at it since. Yet on Thursday morning as I completed my charging exercise I sat up beside by bookcase. Almost as if by magic my hand reached up and plucked George Bayer's Egg of Columbus off of my bookshelf and laid it on my table. After I put away my charging kit, I quickly reread the book and looked at the pattern. I was getting some incredible help. The universe was saying, "Take a look at what George Bayer's pattern says about today's market."
Once before I got such incredible help. That was in 1987. At that time the market was raging. I had a few clients nagging me about when "the top" would be. I was just beginning to look for an answer to that. I bought a new laser printer, which created a problem for me. My software did not eject pages. That led to a happy accident. In that accident I overlayed two charts which were intended to be plotted separately. One was for the XMI index in 1987 (the XMI is another index similar to the S&P 500.) The second chart was for the Dow in 1929.
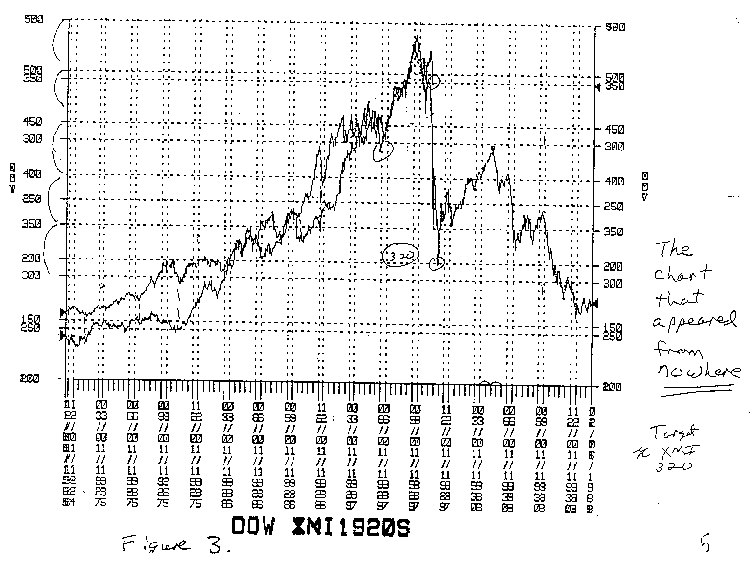
To my amazement the two graphs overlaid exactly. For the next week I watched the two graphs continued to overlay. On Friday, August 16th, I alerted several people to the probability that a crash in stocks was imminent.
On Black Monday, the 19th, I stayed home from by day job at Bell Laboratories and day traded for the first time ever. Mind you, this was done without a real time data system. It was a day I will never forget. I have video tapes of the news reports of that evening. The entire world was in complete shock. The market had dropped 23% in that one day alone. Savings of millions of investors were wiped out in one day.
The general public, the politicians, and even the newly named Fed chairman, Alan Greenspan, had not seen this crash coming. It had come "out of the blue" with the vengence of a tornado. That is the nature of crashes. They are not caused by rational events.
They are caused by rapid shifts in the energy fields that move prices. These energy fields set up patterns that repeat over and over and over. I have seen this particular pattern of an up-bottom Chaos Clamshell followed by a sharp drop many, many times on a smaller scale while day trading the S&P 500. It is breathtaking to behold, but painful to watch if you are long, so don't be long when this is a high possibility.
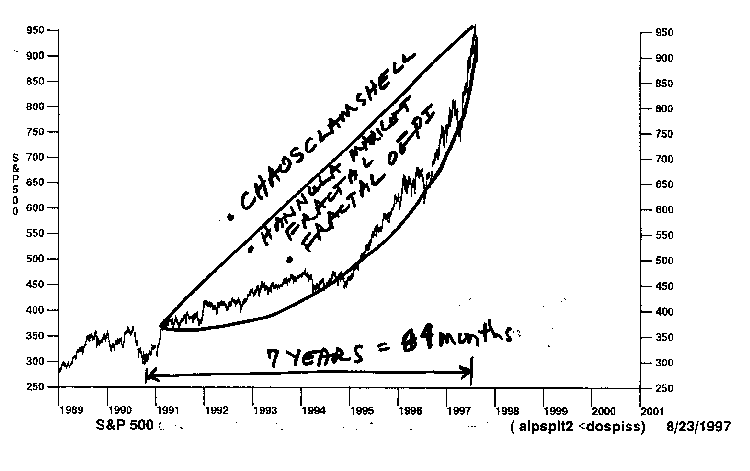
Now let us look at some longer period cycles. This next chart shows an up Chaos Clamshell which lasted 7 years from the 1991 solar eclipse into the current high. Seven years is an important cycle. A legendary trader, W. D. Gann, published one of the most widely circulated summaries of natural cycles used for forecasting. In a seven page paper he outlined major cycles of 60, 50, 30, 20, 15, 10, 7, and 5 years. Of the 7 year cycle he said: "The seven year cycle is 84 months. You should watch 7 years from any important top and bottom. "
Eighty four months is, of course, 1/12th of the Uranus cycle of 84 years. Astrologers know the Uranus cycle as the cycle of change. My research has shown that this is a valid concept. Electrically, Uranus is very unique. It is the only planet whose spin axis does not point up. Instead of pointing up as all the other planets do, Uranus spins "on its side" with its spin axis pointing directly at the Sun. This means that its electromagnetic fields are 90 degrees to all the other planetary electrical fields. This is what gives it its major power to institute changes.
Gann further said, "Seven is a fatal number referred to many times in the Bible. It brings about contraction, depression, and panics. Seven times seven equals forty-nine which is known as the fatal, evil year, causing extreme fluxuations."
This chart shows the 7 year cycle in stocks, as it has formed another up-bottom Chaos Clamshell.
Gann also fit this 7 year cycle into a 10 year cycle. His major cycle of 60 years is made up of 3 20 year Jupiter/Saturn cycles. One half of the 20 year Jupiter/Saturn cycle is 10 years. This led to two of Gann's rules for forecasting major tops and bottoms. His Rule 4 says, "Adding 10 years to any top, will give you the top of the next 10 year cycle, repeating about the same average fluxuations." His Rule 5 says "Adding 10 years to any bottom will give you the bottom of the next 10 year cycle, repeating the same kind of year and about the same average fluxuations." Gann then goes on to discuss bull and bear calendar years. He says "Each decade, or 10 year cycles, which is 1/10th of 100 years, marks an important campaign. The digits are important. All you have to learn is to count the digits on your fingers in order to ascertain what kind of a year the market is in." He says, "Number 4, or the 4th year, is a bear year but ends the bear cycle and lays the foundation for a bull market."
The current explosion in stocks started in 1994, late in the year. Of year #7 he says, "Number 7 is a bear market and the 7th year is a bear year because 84 months is 7/8's of 90, see 1897, 1907, 1917, but note 1927 was the end of a 60 year cycle so not much decline." So it is obvious that in 1997 we have a hundred year cycle from the top in 1897 and a 7 year and 10 year cycle at work. So W. D. Gann would be urging extreme caution at this point.
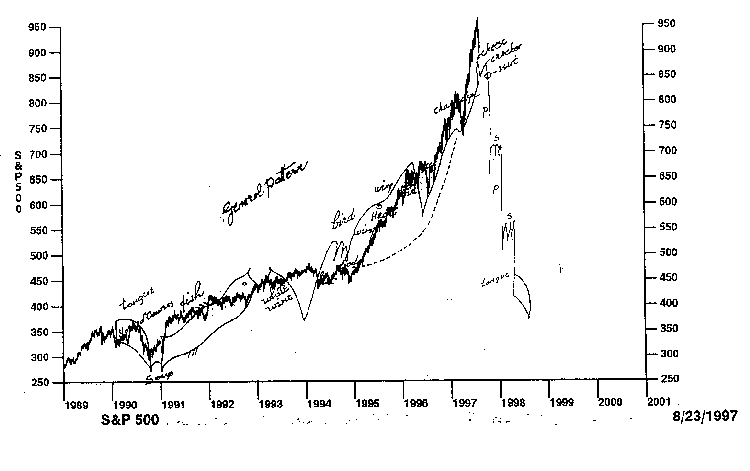
George Bayer would be urging extreme caution, as well. This chart shows how nicely his Egg of Columbus pattern fits the decade of the 1990's.
So there is obviously a Bayer pattern within the 10 year cycle just as there was a Bayer pattern in the 1 year cycle. But what about Gann's 20 year cycle? Is there a Bayer pattern in it as well? The next chart says, Yes!
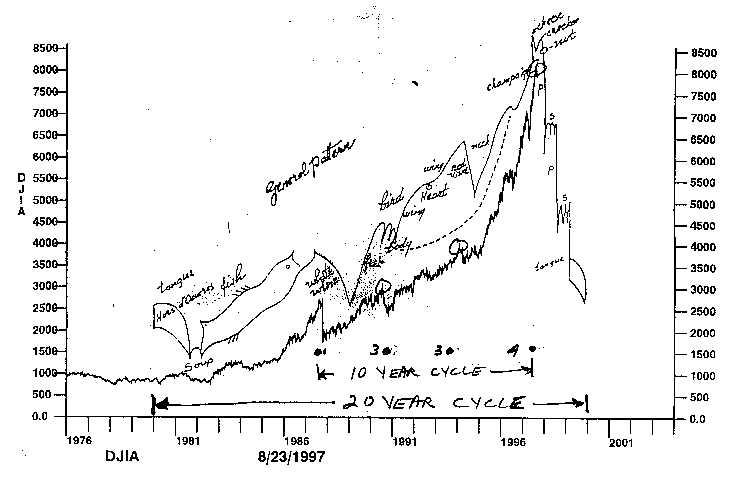
This chart shows the 10 year cycle starting in 1980 with the hors de hors peaking now. Within that, from the 1987 high, I have marked 3 succeeding highs. According to W. D. Gann these highs should occur 3 years, 3 years, and 4 years apart. They did exactly this making highs in 1987, 3 years later in 1990, 3 years later in 1993, and now 4 years later in 1997. So two of the greatest market masters of all time would be telling you to use caution.
Now let's look a little at even longer cycles. 1937 marked a major low in stocks. This chart shows the 60 year cycle since then.
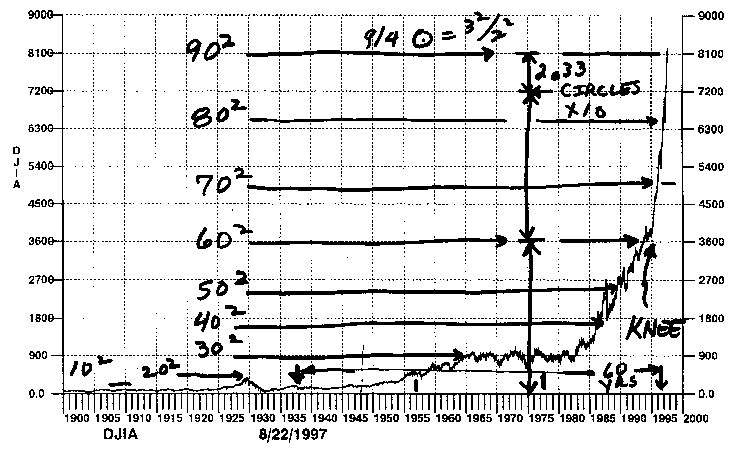
W. D. Gann also articulated the power of square numbers. I have marked on this chart price levels that are 10 squared, 20 squared, 30 squared, etc., up through 90 squared. The Dow has met major resistance at 90 squared or 8100. Its rapid rise in the last year was from 80 squared, 6400, to this resistance level. The rise since 1994 is from the 60 squared level of 3600 to the 90 squared level. This marked a point on the curve that I call the knee. We will return to the topic of the knee in a moment. First, note that prices can be mapped to the 360 degrees of a circle. One simply drops the zeros on the price of the Dow. We see that the Dow ran up to 360 degrees at 3600, then doubled to 7200 = 720 degrees, and now has gone 1/3 of a cycle further to 810 degrees. This 2.33 circles is an interesting number. In my chaos work I have found that multiples of 2.33 are extremely important. In chaos theory there is a number known as the Feigenbaum Number which is equal to 4.66. 2.33 is 1/2 of that number. 2.33 is also 7 thirds. If one takes the 8100 level as 810 degrees and looks at it as fractions of a quarter of a circle, this level is 9/4th's of a circle. The interesting thing is that this ratio of 9/4th's is 3 squared divided by 2 squared. All this means that the market has reached a state of multiple energy harmonics, based upon squares, ratios, and squares of ratios. This behavior only occurs at major market turning points.
History tends to repeat. For those who believe that we have somehow changed the behavior of markets in modern times, I would like to point you to the Nikkei index.
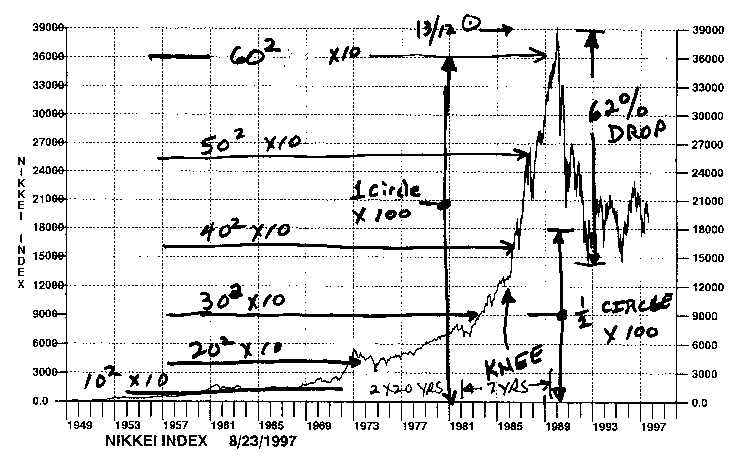
The Nikkei index began trading in 1949. Forty years (2 X 20) later it made an extreme high. Most of the gain occured in the last 7 years of those 40 years. The Nikkei index went into a price level of 39,000. Dropping the two zeros and taking this as 390 degrees we see that this is 13/12th's of a circle. The lucky number 13 killed that market. From that extreme high, the Nikkei dropped 62% in the next two years. It has now been averaging 18,000, which is 1/2 of the circle. Notice that its curve is very similar to the Dow's, showing a rise and a decline, a steep rise and then a knee. Following the knee a very rapid, breathtaking rise to a spike high. That spike high was followed by a severe decline. Also note that prices tended to congest around the square of 20, 30, 40, 50, and 60. History does repeat. Look at today's Dow
There is an interesting relationship between the Japanese market and its drop and the US market. It is possible to borrow money in Japan at a very low interest rate of a few percent. It is then possible to buy US Bonds and earn a "safe" return that is 2-4 times as high as the rate at which the money was borrowed. Japanese banks and investors have done this "big time". But these people have experienced a market crash of their own. How do you think they are going to react if the US market heads down fast? Do you think they might panic? I do.
A major thesis of my work has been that markets respond to natural cycles. The correlation between sun spot cycles and economic cycles has long been established. The correlation with markets has not been quite as clear. After a suggestion made by client, PG, I looked at the relationship between sun spot cycle inverted and markets.
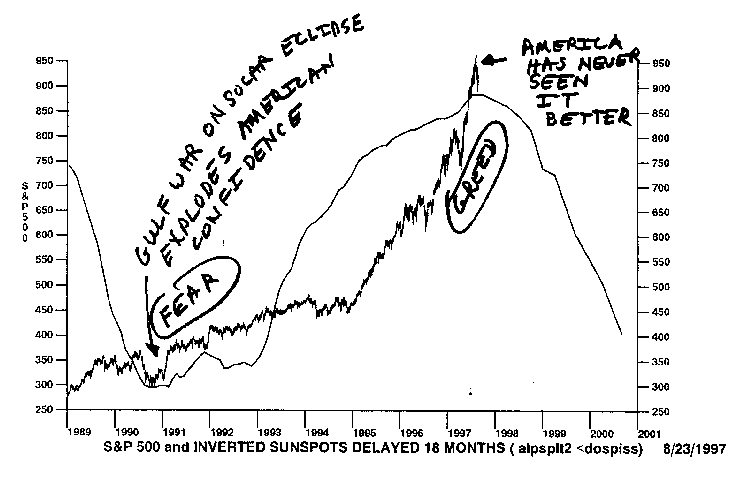
Sun spots block the flow of radiation from the sun. By poking swirling holes in the surface they make it less efficient, so it is logical that the solar radiation reaching earth would rise as sun spots declined. This chart shows the S&P 500 and the inverted sun spots including a forecast into year 2000. The inverted sun spot cycle is delayed by 18 months. This delay would account for a thermal lag in the heating of the earths atmosphere and surface and producing the crops and the general heating that excites the natives.
An interesting point is that the low in this cycle coincided with the Gulf War and a solar eclipse lined up with Uranus. At that time American confidence has sunk sharply. As we entered the war there was a great state of fear. As the war developed, American confidence exploded. From there, confidence, as well as the market, rose steadily into 1994, and then rose rapidly as the sun spot cycle fed it. Now at the peak of the inverted cycle we have a situation where America has never seen it better. There is word now of a New Economy which is so efficient that productivity just keeps rising. It is a myth. It is an illusion. It is not true. The internet and computers have not changed the natural cycles. Fear has been replaced with greed. Cracks are starting to form. The UPS strike showed that business disruptions can quicky bring the new Just In Time economy to it's knees. Those who have not shared in this explosion of wealth want their cut, too.
Earlier this year I published a chart showing the equation of time and the market. The equation of time computes an adjustment to a time measured by a sundial to account for the advancement or retardation of the sun. This is a change of the relative velocity of the sun due to the earth's orbital eccentricity and the earth's tilt. My research found that the peaks, valleys, and midpoints of the equation of time corresponded very strongly with turns in markets.
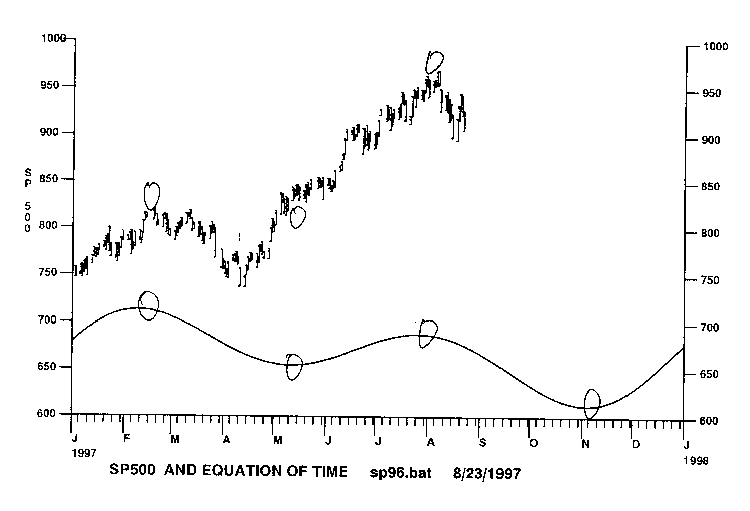
This year the pattern is very obvious, having peaked in February as the equation of time peaked. Even though a low was made in April the market did not take off sharply until May, when the equation of time bottomed. The peak in August came as the equation of time peaked. If the market follows the equation of time down it will bring it to November 5th. This is consistant with our fractal anaylsis, Gann's warnings, Bayer's warnings, Larry Pesavento's '87/'97 overlay, and every other tool I know of. Again, it points to a very dangerous time for stocks.
We are all lunatics. Many of us just don't know it. Many of us just don't realize how badly effected we are. This effect is shown most dramatically if one studies the relationship of eclipses in markets. Many readers have read my article, "Trading The Eclipses", or purchased my research report of the same title. That report showed that half of the eclipses had very powerful effects on markets. The eclipses which had the most effect were those that were also lined up with a particular planetary pattern. The second thing that showed up was that the pairs of planetary eclipses where a solar eclipse is followed two weeks later by a lunar eclipse were the most powerful. This effect has also been discovered by Steve Puetz, publisher of the Steve Puetz Letter. He found that market crashes tend to come near the full moons that are close to solar eclipses. He found this true for the Tulip-Mania Bubble, the Mississippi Bubble, the South Sea Bubble, the Great Crash of 1929, the 1977 soybean crash, the metals crash in 1980, the 1987 crash, and the 1990 Tokyo crash. Good work, Steve! Thanks, LP for forwarding that to me. Steve's warning is that the panic that followed these eclipses usually lasted 2-4 weeks and lopped off about 50% of the market price.
This next chart shows the planetary positions for the solar eclipse of September 1st.
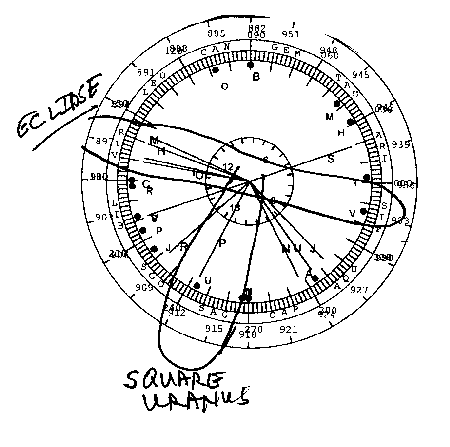
It shows that Mercury is lined up with the eclipse and that this eclipse is lined up with the S&P's natal position of Venus. Mercury lined up with the Sun is something that astrologers call "Combust". It greatly accentuates the effect of an eclipse. An eclipse lined up with the S&P's natal Venus means that the benefit of Venus in carrying the market upward, will be temporarily halted. This eclipse is also square to the S&P's natal Uranus. Earlier in the year I pointed out that this natal Uranus being transitted by Pluto and then by Jupiter is what kicked off the bull market in 1994. Uranus is the father of the 7 year cycle. Seven years ago the eclipse on Uranus started a seven year cycle. An eclipse square to Uranus in the S&P natal chart is what one could expect if this cycle is to terminate.
The next chart shows the lunar eclipse for September 16th.

This eclipse comes very close to being lined with the S&P's natal Mars and natal Moon. These two cycles bring great volatility to stocks. In day trading I particularly watch for volatility on the days when the Moon passes either of these points. It will pass these points exactly on September 17th, so September looks to be a very dangerous month. Statistically September is the worst down month of the year for stocks. With the two eclipses set up the way they are, the makings are there for a crash. W. D. Gann's greatest book is The Tunnel Through The Air. On page 56 he says that Robert, the hero, learned of eclipses from the Bible. Robert reads in Ezekial 32:7
"And when I shall put thee out, I will cover the heaven, make the stars thereof dark; I will cover the sun with a cloud, and the moon shall not give her light."
The book continues, "Robert understood this to mean the two great eclipses that would occur in June 1927."
Gann knew that those eclipses were going to drive the market down into a low. Those eclipses were square to the great expansion planet, Jupiter. He knew that following this low there would be a strong rally in '28 and '29, according to his 10 year cycle. This is how Gann found the market peak in 1929. If W. D. Gann were alive today he would be looking for the same type of action in 1997.
So these one-two punches of eclipses in the 7th year of the decade, lined up in September, have been known for many years, and have been known to be deadly. It is not a time to sit on your laurels and count your paper winnings. Park those paper winnings in a safe place until after the danger passes.
This chart shows how the market is currently responding to the moon.
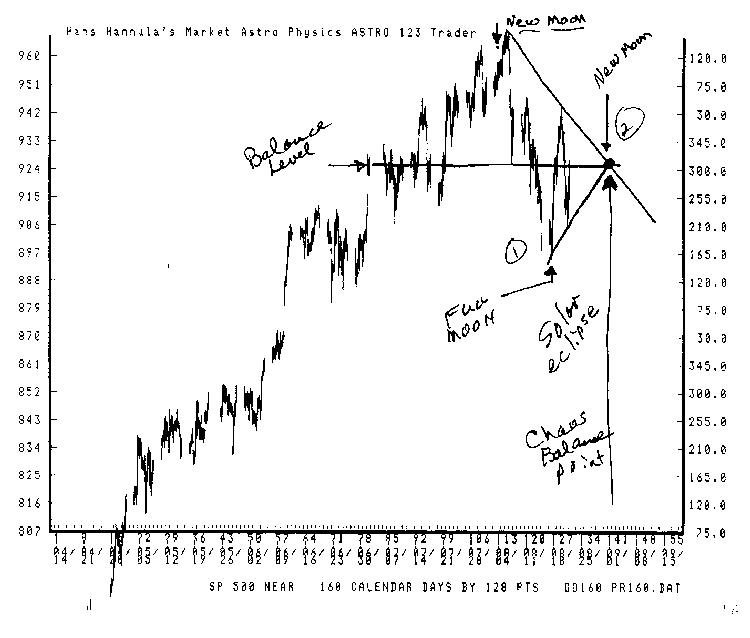
The market peaked shortly after the new moon, ran down sharply into the full moon, and is now congesting into the solar eclipse, new moon. The sharp decline from the new moon to the full moon formed what I believe is leg 1 of a downgoing Chaos Clamshell. The current sideward congestion is begin caused by the solar eclipse holding prices up. This is a Chaos Balance Point. If the balance is broken by a move below the 922 level in the S&P, prices should move sharply down.
As a day trader I watch very carefully how the moon effects the markets during the day. In particular I watch the operation of the rotating earth. As the New York Stock Exchange is rotated through the sky it makes angles with all of the planets and the moon. The most dramatic turns come when these alignments harmonize with the rotating earth.
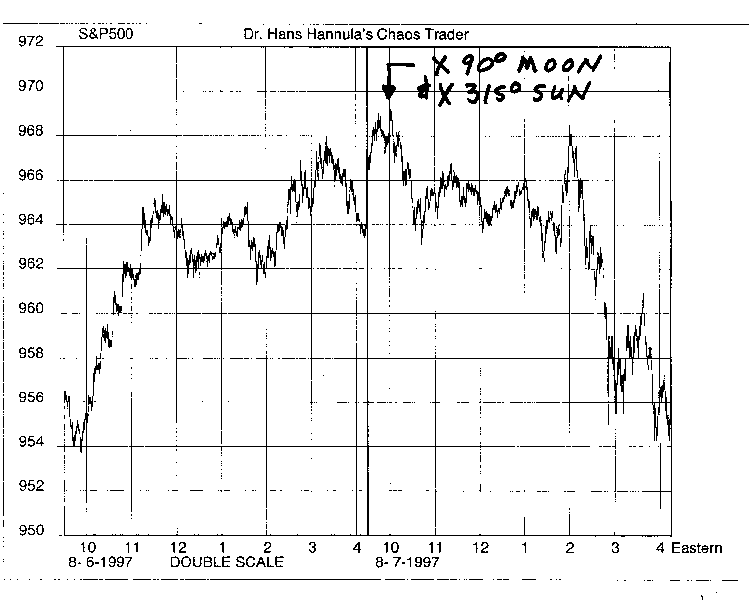
On August 7th, at 10:00 AM Eastern, the earth rotated the exchange 90 degrees to the moon and 315 degrees to the sun. This represents the 4th harmonic of the circle with the moon and the 8th harmonic with the sun. So the moon and the sun became crisply synchronized that day.
The market moved down sharply. It moved 360 degrees in price until August 18th. As it came into the low on August 18th, it made a George Bayer tongue. It bottomed a few moments after the exchange was zero degrees to the sun, or solar noon, 180 degrees to the moon.
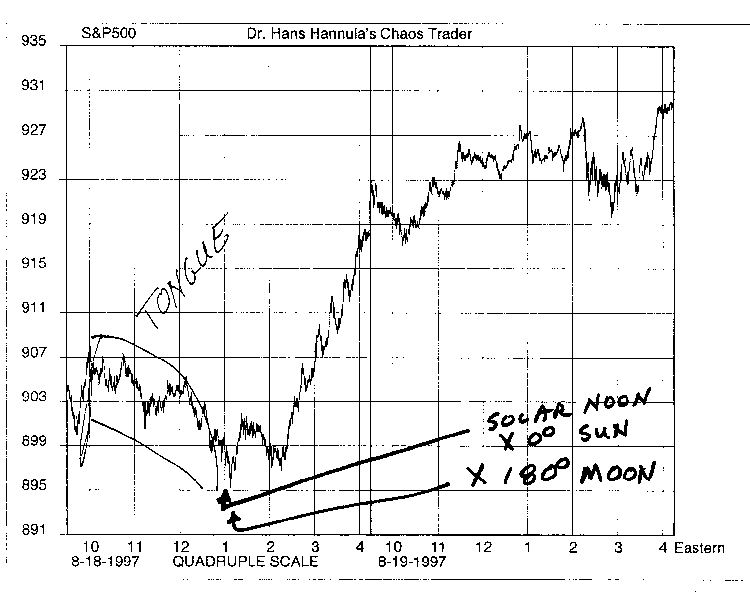
Then in the next 3 days it posted gains of over a hundred points per day on the Dow. That rally stopped on August 21st as the earth again rotated to bring the moon and the sun into close harmony.
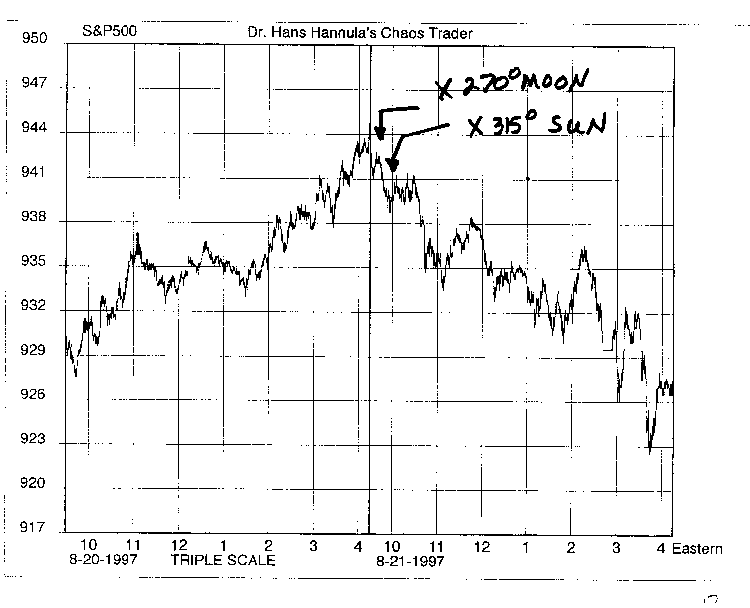
At 9:47 AM Eastern the moon was 270 degrees to the sun which was 315 degrees to the exchange at 10:00 o'clock. Not quite as perfect as the harmony on the 7th. This harmony was enough to again turn prices down sharply.
To get a market crash, a market must first set up high frequency energy cycles. It has already done that. In my Cash In On Chaos course I call these cycles fibrillation, like the fibrillation of rapid heartbeat that occurs just before a heart attack. They are a precursor to chaos. If they are not stopped once they pass a certain point, a chaotic break will occur. If that break occurs, you do not want to be long in stocks.
The moral of this somewhat long newsletter is this: If you are an investor in stocks, get out now and wait for calmer times. Capture those big gains that you have made over the past few years. Then if the market resumes its rally, get back in, or if it breaks sharply, wait until it has established a solid bottom and then reenter at much lower prices.
If you want to try to short the crash, do it with "cheap seat" options. October puts that are as far out of the money as possible would be appropriate. Longer term LEAP options in your least favorite stocks may also be appropriate. Take position before the Solar Eclipse on September first.
Of course, forecasting is an imprecise art. I could be completely wrong in this situation. If the market breaks to new highs, I was definitely wrong, so one should pitch this writing in the trash.
But based upon everything I know about markets, the observations of my good friend, Larry Pesavento, the work of market legend George Bayer, the work of market legend, W. D. Gann, the work of many on the effects of eclipses, the statistical probabilities of September being down, the statistical nature of the seventh year in a decade, the planetary cycles, and my own real time observations of the current effect of the moon on the markets, I remain firmly convinced that the danger over the next two to three months in the stock market is extremely high. I would be imprudent if I would not advise you to get out of such a market.
Happy Trading,
Hans Hannula, PhD, CTA
![]()
![]()