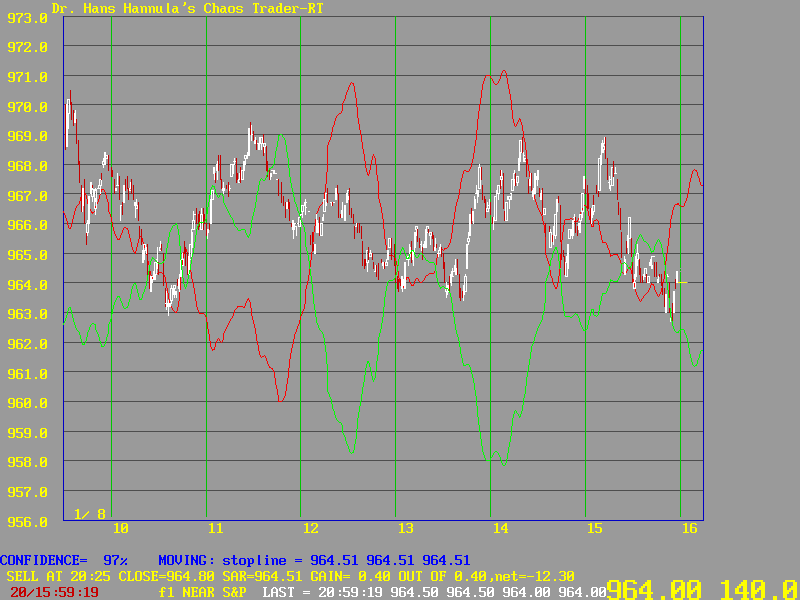


FIGURE 15.
Such a day is shown in Figure 15. This shows the market for January 8, 1998, just prior to the close. For the first hour the market followed the inverted forecast. It then switched to the normal forecast for a hour and a half, then back to the inverted forecast going into one o'clock Eastern time (1300 hours). The market then congested for a half an hour. Then it followed the inverted forecast until late in the day, when it congested between the two forecasts.
SP.IXGO is a totally new technology. It represents an accurate simulation of the physics of electric currents that drive the emotions that drive trader's activities. This simulation takes into account the fact that electric fields occur in positive and negative pairs, and that these positive and negative fields create chaotic market systems. These chaotic systems then follow one of three behaviors. They follow the positive fields. the negative fields, or a combination of the two. While this is not the ideal trading situation, it is how markets are actually constructed.
To succeed a trader must accept this result and focus his or her energies on utilizing this new SP.IXGO trading technology.
Here are a few other closing SP.IXGO charts.