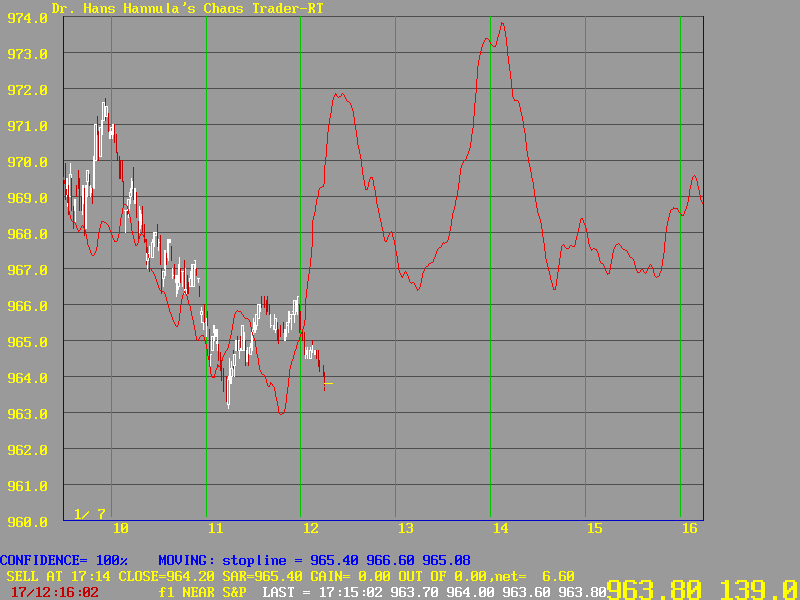


FIGURE 5
Figure 5 shows the market forty minutes later. The market has followed the inverted forecast until the last few minutes. This is a sign to the trader that something else might be going on so perhaps the normal forecast should be placed back on the screen.