
We'll keep posting XGO examples here as they occur, with most recent first. We're not going to post everything we do, just some decent examples to give you a feel for the usefulness of XGO. Each chart has the date on which it was posted.
The trades shown on this page would easily pay for the XGO software.
Remember, futures trading is risky. You can lose more than your original investment. Past performance is no guarantee of future performance.

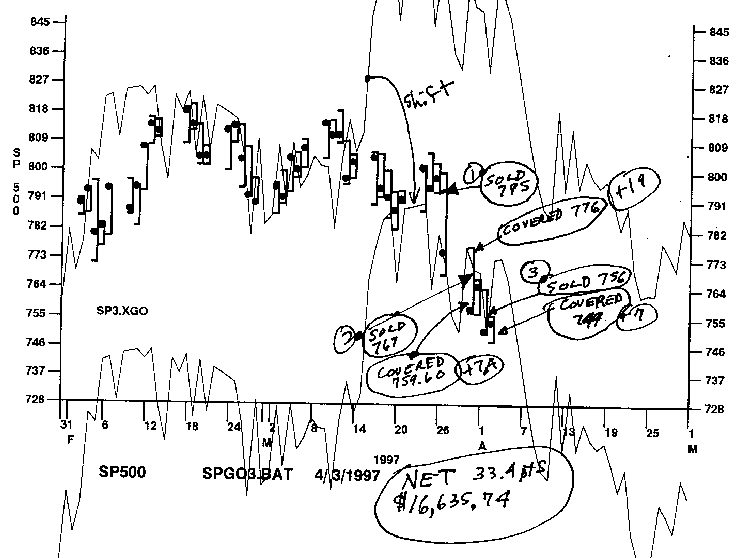
Here's our last 3 S&P XGO trades. XGO had a chaotic shift going into the lunar eclipse, but still is following extremely well.


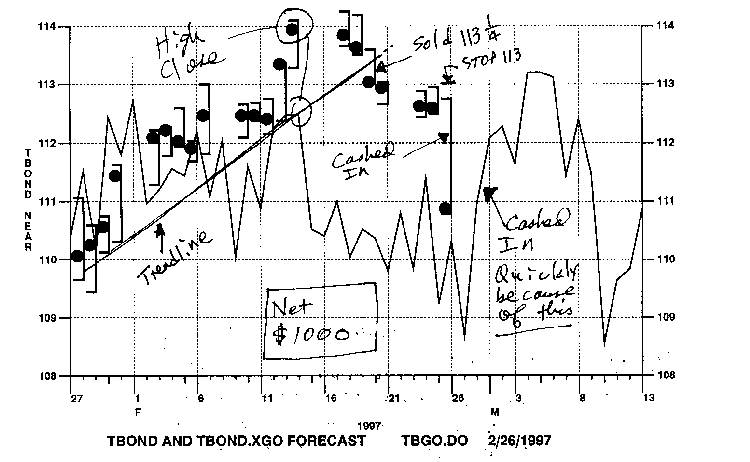
These are last two trades in Tbonds. A modest loss. Took profit Friday because of weekend low in XGO.

On this trade we anticipated the trend line break using XGO, and placed a sell stop at 113 1/4. We cashed in at 112 1/4 on the "Greenspan" break. So how did XGO know what Greenspan would say? It's all in the energy fields before its in the news.

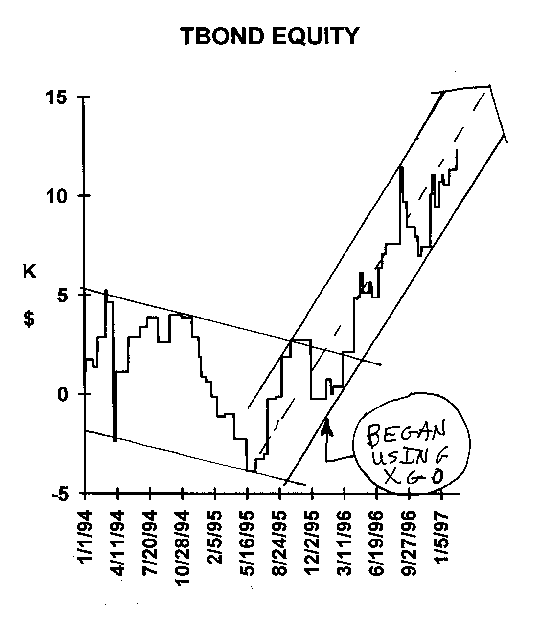
The value of XGO is shown clearly in our Hotline TBond equity curve. For years our equity curve in TBonds oscillated about zero, going up $5000 then down $5000. Once we began using the XGO in TBonds our results have dramatically improved.