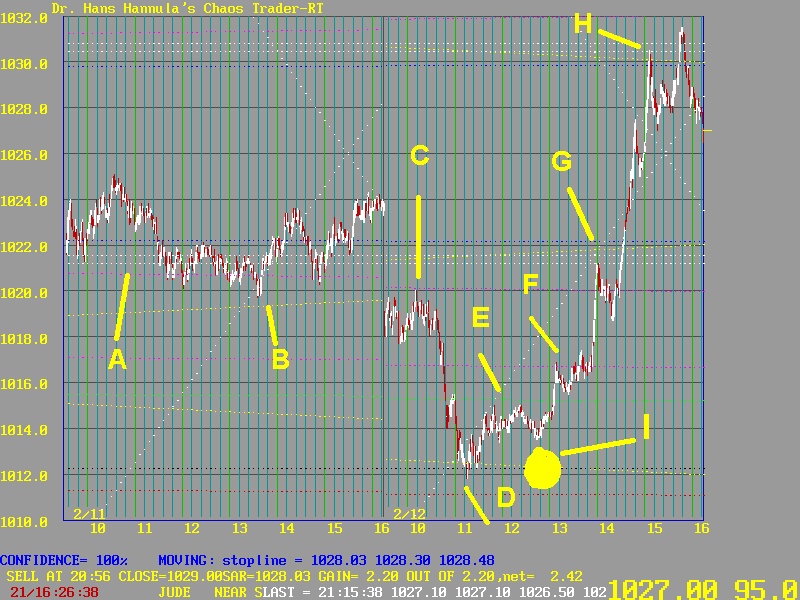


Many doubt that the planets and the moon affect markets. I don't because I watch them all the time with my Chaos Trader RT program. This program lets me draw, in advance, price support and resistance lines caused by the electric fields associated with each body. On this screen, the horizontal yellow lines are DA MOON. The magenta ones are MERCURY. The blue one is VENUS. The green one is SUN. The black one is SATURN. The horizontal white lines are PLUTO. The white line at about 60 degrees is the rotating EXCHANGE. Prices tend to congest about these lines.
At A, (on Feb 11) Mercury was holding price pretty flat. And the moon was also attracting prices, as at B.
Overnight, the moon line moved above the Mercury line. That made the MERCURY line a repellor. When prices touched it at C, they were driven down hard. They bottomed at D, where MOON and SATURN brought support. They started to follow the EXCHANGE line E. MERCURY slowed the advance at F. At G the cluster of PLUTO, MERCURY, MOON, and VENUS caused congestion. When that was broken, prices did a "BAND GAP JUMP" to another cluster at H.
Notice how these clusters of electric field flux lines QUANTIZE price? It's pretty awesome. It's all electric fields in action.
Now, notice the yellow ball marked I. That's the FULL MOON lined up with the EXCHANGE. See how it acted as a STRANGE ATTRACTOR (SA) before 12:50 Eastern, then as a STRANGE REPELLOR (SR)afterwards? That's where chaos theory comes in. Prices move from one of these SA/SR points, to another.
The trick is to find them. I work hard at that, but it is never easy. There are at least 11 overlapping electric fields. My SP.IXGO forecast is my best effort to date to find the path prices will follow through these electric fields. To see SP.IXGO for Feb 12, 1998, go up a level and select the link at the bottom of the page.