
|
This page did shows a live S&P trading screen on most Fridays. Now that live screen is shown at Daytradingforecasts.com This page still has explanations and links to current pages of interest. NEW FOR July 19th, 2002 THE MOON IN ACTION CXVII-Solar Flare at Work at bottom of the page The chart shown on this page is part of the TOMORROW'S MARKET EMAIL service. That service costs about $5 per trading day, less than 1 commission. Tomorrow's Market Email is $297 per 3 months, with auto renewal. Forecasts are also available as data files $360 per quarter. Subscribing to this service lets you trade the MoonTides the other 4 days of each week. We provide the same color chart as you see here during the Chaos Clinic, plus written comments and trade recomendations. If you want a free sample of TOMORROW'S MARKET EMAIL emailed to you each Friday, you have to be in our database.
To get in our database, sign up for our free newsletter. If you want to subscribe, go to The Chaos Catalog and order TOMORROW'S MARKET EMAIL. WARNING- THIS DISPLAY HAS AN UNPREDICTABLE DELAY SO DO NOT USE FOR ACTUAL TRADING. USE A GOOD ONLINE SYSTEM WITH A GOOD ONLINE DATA FEED! THE CHAOS CLINIC IS FOR TUTORIAL PURPOSES. FUTURES TRADING IS RISKY. YOU CAN LOSE MORE THAN YOU PUT UP TO ENTER A TRADE. Tip: to update just the chart, set your browser to point to http://www.moneytide.com/hans/trade.gif This screen is live from Chaos Manor (http://www.moneytide.com/hans) on Fridays. Set you screen to 1024x768 if possible. The graph is 800x600. Updates will be done about every 20 minutes, so periodically refresh your browser. Al says "Feel free to copy, print, or email this page to your friends or post it in newgroups. I depend on referrals for my business, so any help would be appreciated. Without your support my research is not possible."
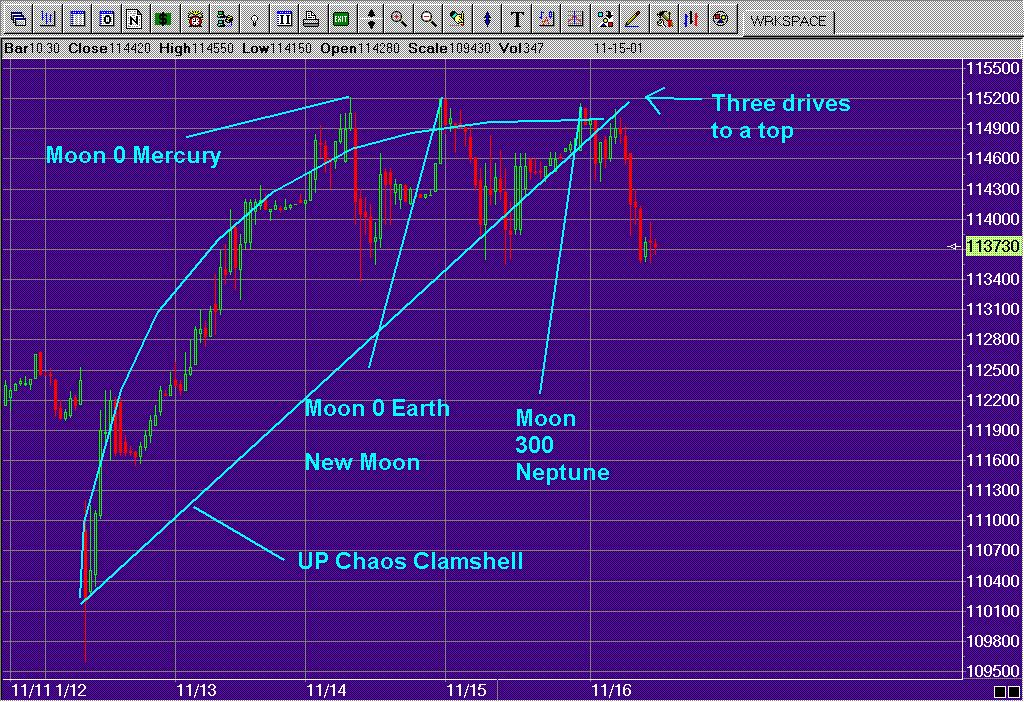
This is the live (on Fridays) trading screen.It shows Dr. Al's incredible MoonTides and MoonTide forecasts.
This screen changes often during the day as Al adjusts it to follow the market. The green line is the normal MoonTide forecast. The red line is the inverted MoonTide forecast. These are the basic forecast. The market tends to follow one of the MoonTides during the day. It may switch from the normal MoonTide (green) to the inverted MoonTide (red). This is because markets are chaotic, and chaotic systems always have at least two solutions. Normally there are no or just one inversion during a trading day. The times of MoonTide turns are often within minutes of market turns. The pattern and number of moves is very often correct.
|
