
Feb 15, 2001
Last Sunday evening, the waning Full Moon passed Venus. It was a nice sign in the evening sky. I expected it to show up in the market on Monday, expecially since Monday was a "two Moon day."
These are days when the Exchange makes two alignments with the Moon. By alignments, I mean the Moon passes overhead, under foot, or is 90 degrees to either side. I show these four Moon phases as vertical yellow lines with Moon symbols on them on my trading screen.
So did the Moon and Venus show up in the market? Look for yourself.

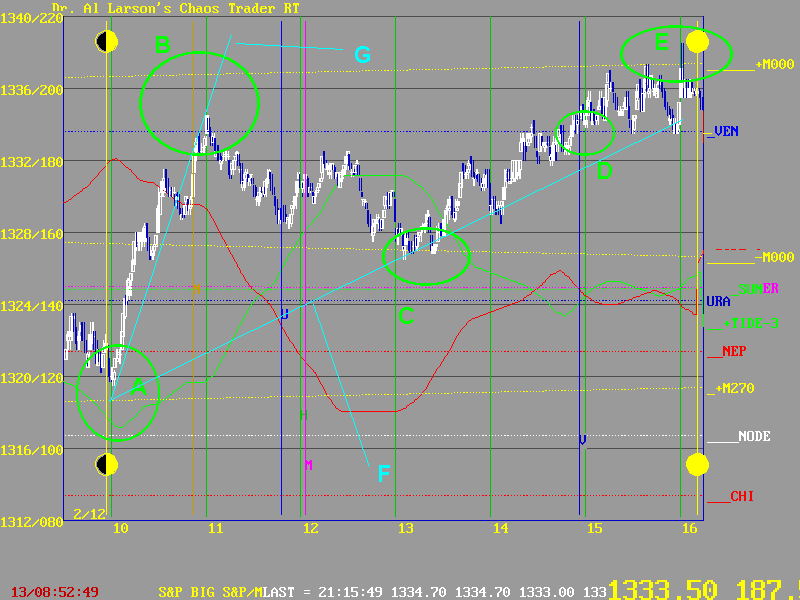
The day opened with prices at the Moon's +M270 electric field flux line as the Exchange passed the Quarter Moon at A. The Quarter Moon was "entering the market."
The green +MoonTide was turning up. And the market did rally-right up to the blue Venus electric field flux line. They fell short of the +M000 Moon electric field flux line. But the day was not over.
Prices pulled back to C, where they bottomed on the -M000 Moon flux line. That was the midday low. Then, as the earth rotated the Exchange toward Venus (vertical blue line near 3:00 ) prices rallied back to the Venus flux line, shown at D.
The Full Moon was "leaving the market." The Exchange was passing it just minutes before the close. That was enough to pull prices up to the Full Moon electric field flux line at E. So the whole day was a "Moon to Moon" move.
Of course, the rotating earth was also at work. If one draws the electric field flux line for the earth, starting a A, one gets the line F. Note what a good trendline this made for the day.
I've written many times that the S&P likes to run on the 6th harmonic. The line G is the 6th harmonic of line F. In Gann terms, F is the 1 x 1 and G is the 6 x 1. So these harmonics are also at work.
It's all Market AstroPhysics in action. The Moon does move the S&P.