
DECEMBER 16, 1999
There will be a nice "sign in the sky" this Friday night, as the Moon passes Jupiter and Saturn in the Western sky. Now, if you have followed my work, you know that usually such western sky "setting signs" lead to rallies. I think this one is going to do that. There are already some good indications.
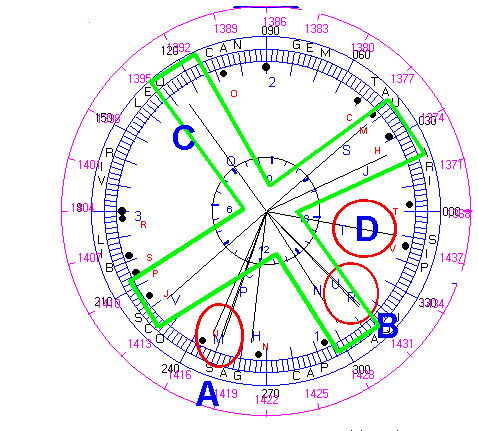
Let us start with the ephemeris wheel. The wheel for Wednesday is shown here.
It is drawn with my WinGephi program.

At B, We see Mars conjoining Uranus. The Exchange will rotate past this point at about 3:30 PM.
At C, we see a Grand Cross formed by Neptune, the Moon's Node, Venus, and Saturn/Jupiter. This grand cross tends to make cycles run on the 4th harmonic. But at D, you can see that the Moon has just passed squaring Chiron/Pluto, and is dividing the southeast part of the Grand cross into equal parts. This sets up the 8th harmonic, or frequency doubling.
As the Moon rotates up the right side of the wheel, it will pass Jupiter, then Saturn, making the "seeting sign." Then it will line up with Mercury, Chiron, and Pluto, When it does, volatility should rise sharply.
So is any of this visble in this week's price action. Look at the three day chart below.

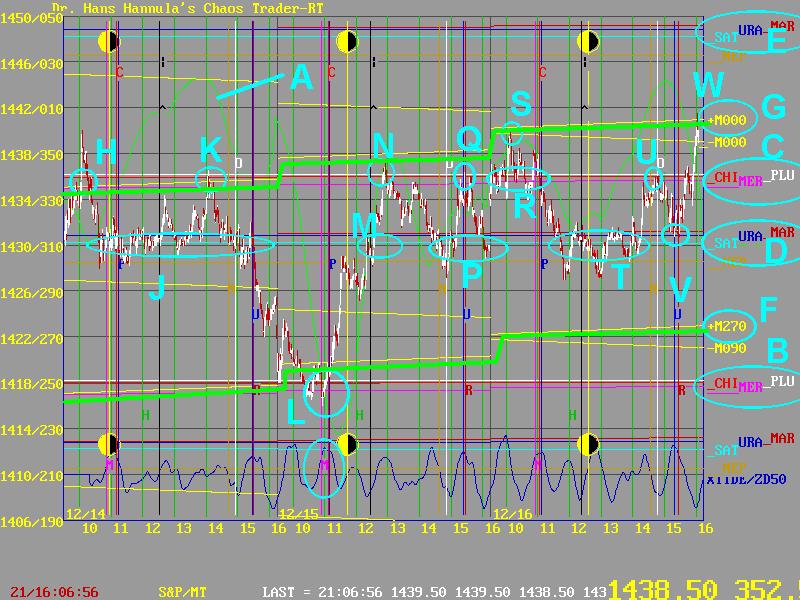
First, the green line at A is the +MoonTide. It make a very good forecast for these three days.
Now look at the right of the chart. The electric field flux lines form clusters when planets align. The flux lines at B (1418) and C (1436) are due to Mercury, Chiron, and Pluto. The Mars/Uranus/Saturn flux lines are at D and E.
Rising through the chart are two Moon flux lines, the +M270 line at F, and the +M000 line at G. One can see how this pair of Moon flux lines has formed an up channel for prices these 3 days. The +M000 flux is associated with the Quarter Moon symbol shown on the charts as a vertical yellow line with the Quarter Moon ball on it. You can see that the Quarter Moon transitted Mercury, Chiron, and Pluto on Wednesday. This is just another way of sayinf the Moon squared them.
Now for some more detail. On Tuesday the 14th, prices met resistance at H and K, on the Mer/Chi/Plu flux, and spent much of the day vibrating about the Mar/Ura/Sat flux at J. Late in the day they declined as forecast by the +MoonTide.
On Wednesday, prices bottomed EXACTLY as the Exchange passed Mercury, entering the Mer/Chi/Plu time cluster shown by the verical lines. Prices got support at the Mer/Chi/Plu flux cluster, with support from the +M270 Moon flux. At this point price on the Mer/Chi/Plu flux was square time, as told by the Moon. This set up a rally.
The rally paused at the Mar/Ura/Sat flux at M, then topped at the Mer/Chi/Plu flux at N. The pullback at P was back to the Mar/Ura/Sat flux. The low at P came as the Exchange passed the Moon's node, part of the Grand Cross. Prices topped again at Q, on the Mer/Chi/Plu flux lines as the Exchange passed Mars and Uranus and squared Saturn.
On Thurday, prices vibrated about the Mar/Ura/Sat level at R, but make a spike high on the +M000 flux at S. This is an example of how the Moon starts to "pull prices through" the flux fields set by the other bodies.
Prices congested as they vibrated about the Mar/Ura/Sat flux at T,rallied to the Mer/Chi/Plu flux as the Exchange passed the Node at U, then bounced of the Mar/Ura/Sat flux again as the Exchange passed Mar/Ura at V, and finished with a fast rally to the +M000 Moon electric field flux at W.
That is a lot of action in 3 days. But it is not at all random. Every bit of it can be traced back to the ephemeris wheel. These electric fields are real, physical things. Prices do react to them.
In this chart, the key feature is the low at L, where prices bounced off the Mer/Chi/Plu flux lines. This was the center of a Strange Attractor, now turned Repellor. Unless prices break this low, they should be repelled upward.
Gann talked about "lost motion." Sometimes a turn would come in a few days early or late. The cause of this is the Moon. In this case, the Moon set the Mer/Chi/Plu low, before Mecury made an exact alignment.
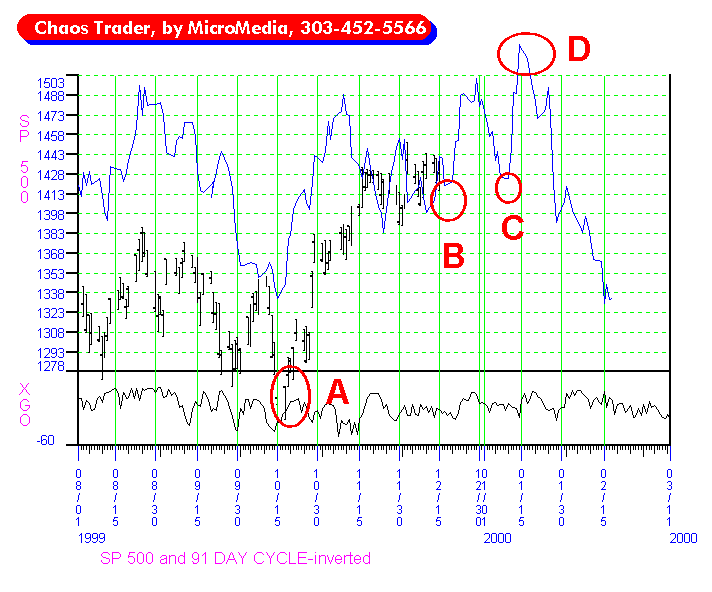
Now take a look at the longer picture.

We are currently at B, as Mercury passes Chiron/Pluto. The current rally began at A, as the Sun passed Chiron/Pluto.
So can you figure out what key planetary actions are set up at C and D? Can you deduce a physical cause for these forecast turns? This is left as an execise for you. If you need help, here is a hint: LOOK AT THE EPHEMERIS WHEEL.