
July 27, 2000
This may sound like a broken record.
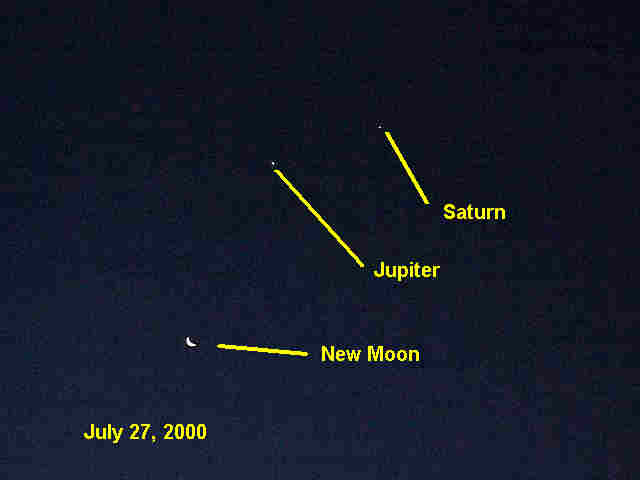
This morning, on my way to the park with Ace, I snapped this picture of the rising sign that has been there since yesterday. Of course, yesterday the Moon was to the right of Jupiter and Saturn.

I've noticed that rising signs tend to tank the market. Here's how this one showed up.

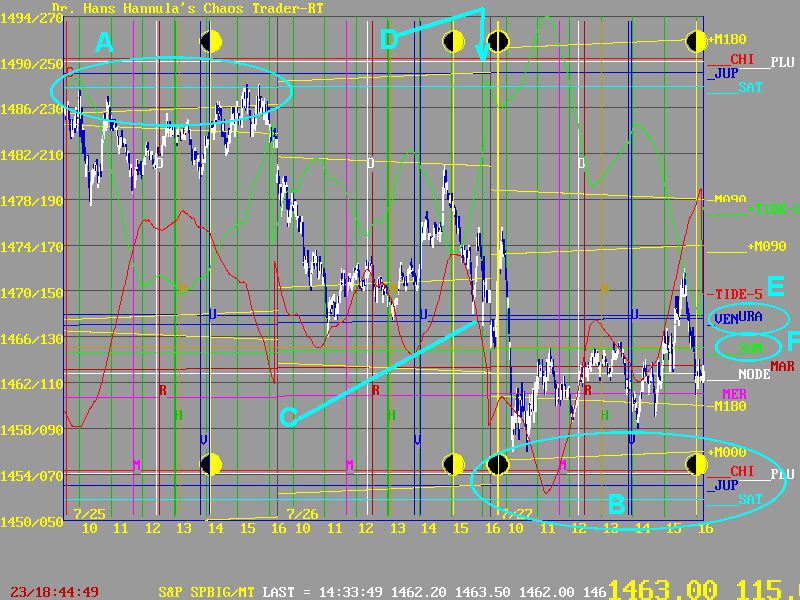
At A, you see that on the 25th, prices held close to the Moon +M180, Jupiter, and Saturn electric field flux lines. Then they declined as the Moon passed Jupiter and Saturn, to the set of Moon +M000, Jupiter, and Saturn electric field flux lines at B on the 27th.
Enroute, prices followed the -MoonTide (C) pretty well. Note the late high on the 26th bounced right off the -M090 Moon flux, as the Exchange squared the Moon, which I show with the vertical Quarter Moon line and symbol. Midpoint.
The picture was taken at D. The Exchange passed Jupiter and Saturn just before the open on the 27th, then encountered the New Moon. It had just "entered the market." Just after the Exchange passed the New Moon, prices dropped 24+ points in 20 minutes. How's that for cause and effect?
Prices didn't quite reach the +M000 Moon flux line. The reason is that other things are going on, other energies are at work. For example, Venus is opposing Uranus- shown at E. Note how they set the lows yesterday, and timed the low just after 2:00 today.
The Sun is opposing Nepturn, shown at F. Note how that set yesterday's close and stopped several rallies today.
So there was more than the rising sign at work. But when you see one like this, you know that the odds favor a drop. That is - if you have learned to read the signs!