
January 7, 1999
Every year starts out the Cycle of the Year. This cycle is governed by the Moon's Node. The Moon's Node is the line where the moon's orbit intersects the earth's orbit around the sun. The node moves opposite the direction that the planets rotate. This is because it represents the reaction of the moon to the action of the planets. So it acts as a big "summing junction." The Moon's node is well know in all ancient astrology systems. The Chinese call it the Dragon.
Wall Street folklore used to say that the Gnomes is Switzerland ran the market. They knew. Well, I think the Gnome is the Node, and THE NODE KNOWS.
Each year the Earth transits the S&P Natal Node near January 8th. That point turns out to be a major high or low for all or most of the year. Check it out on some past charts.
So which will it be this year? A high or a low? And what forces are at work? Let us see.
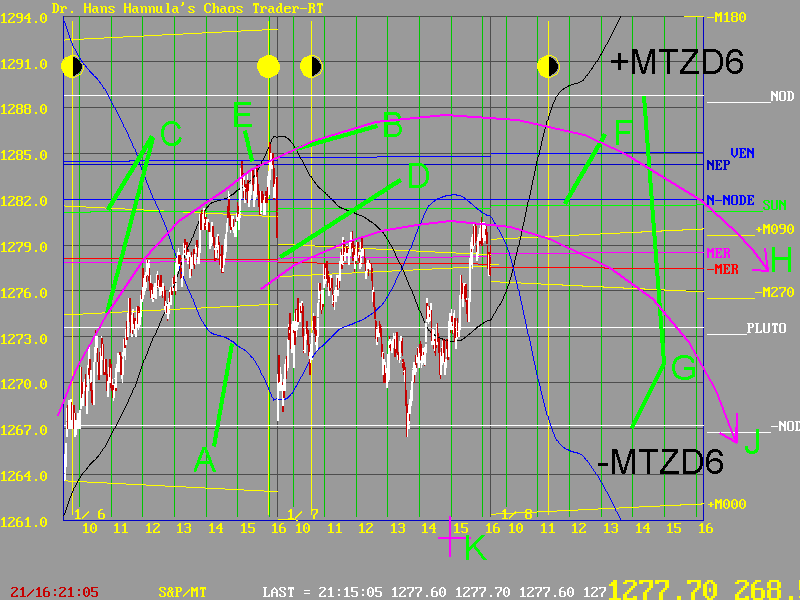
This chart shows the S&P 500 for the past two days, along with space for tomorrow.

First, recall that 90-92 days from a major low is time to watch for a high. The Crash of 1998 low was October 9th. So maybe we are making a high. But we need to see evidence.
We did see a record high yesterday, after a gap up open. The Market followed the +MTZD6 6-8 day MoonTide shown at B. The inverted version is shown at A in blue. Which version did the market follow today?
You could argue for either one. What we have here is a Chaos Balance Point at 1278. Overnight, the market sold off, starting at midnight-when the Exchange lined up with that Natal Node.
Something else is different between January 6 and 7. The Full Moon has "left the market." The market is now in a Quarter Moon phase. Now note the yellow Moon electric field flux lines at C. The -M270 and +M090 flux lines cross. The -M270 is acting to "sweep prices lower." But it has not yet won the battle.
Look closely at point E. The high price was set by the blue Venus and Neptune electric field flux lines. Venus is now separating from being conjunct Neptune. That line was a Strange Attractor which became a repellor when prices reached it.
Just below that line is the S&P Natal Node (N-NODE) and the SUN line at F. This also looks like it turned into a repellor. It is typical of January highs and lows to turn on a Sun/Natal Node flux line. So this becomes an important barrier.
Ah, but this year is special. Not only do we have a Full Moon at this Natal Node date, but Mercury is involved. Look very closely at the two lines at D- the magenta and the red Mercury Flux lines. They crossed overnight! Along with the Moon Flux lines, they helped set the Balance point at 1278. The crossover is the cause of the gap down "discontinuity." And whe have another one overnight tonight as the Moon Flux lines crossover. It's these discontinuities that create the chaos.
G shows the electric field flux lines of the current node. The fact that today's low was on the -NOD line simply tells us that the Node is involved.
Also show are two arcs at H and J, rotating about a center at K. This may be part of a FireBall. Note that the rotation tomorrow is down.
Early tomorrow the -MTZD6 and +MTZD6 lines "bifurcate." Then they are one way all day. Can we predict which way they will go? No. But a trader does not care-just go with the flow.
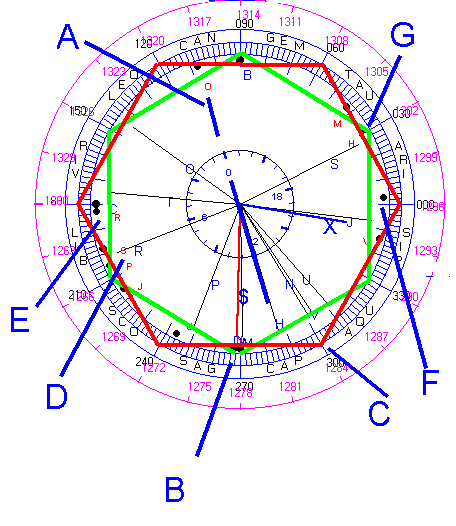
Now for some more more insight. Here is the ephemeris wheel for January 7.

The S&P stable Hexagon is shown in red. The unstable one is shown in green. We are currently having a "Battle of the Hexes."
Mercury at B is controlling the unstable green hexagon. Neptune and Venus were controlling the stable one at C. But that effect weakens as Venus separtes.
Another destabilzing force is Mars at D. It is transiting Natal Saturn, Pluto, and Jupiter in quick succession. These are the S&P's "wash board road." Earth transits them in April and October - the months of the biggest drops. As Mars transits these, it ads energy to the unstable green hex. Saturn at G tranisting natal Sun (little red H) adds to this hex as well.
Then there is the Moon ( blue T) opposite Jupiter at E. The Exchange lined up with Jupiter on the Close, shown by the blue X line. Prices close at point B. This could well be a "squaring of time and price." Prices are on the unstable hex.
Tomorrow, on the 8th, the Moon will advance to transit the S&P natal Moon shown by the dot at F. These transits usually bring high volatility.
So we have the market at a critical point. The outcome will be known soon. If the market tanks, I am sure it will be blamed on the Senate Trial of the President, with phrases like "... the market hates uncertainty." But those who study the real system will know that the market and the trial are just part of the same chaotic energy system. Whatever the outcome, the move from here will set the tone for the year.
That energy system runs everything. And we are all a part of it. There are no accidents, just the energy system, bifucation points, and chaos.