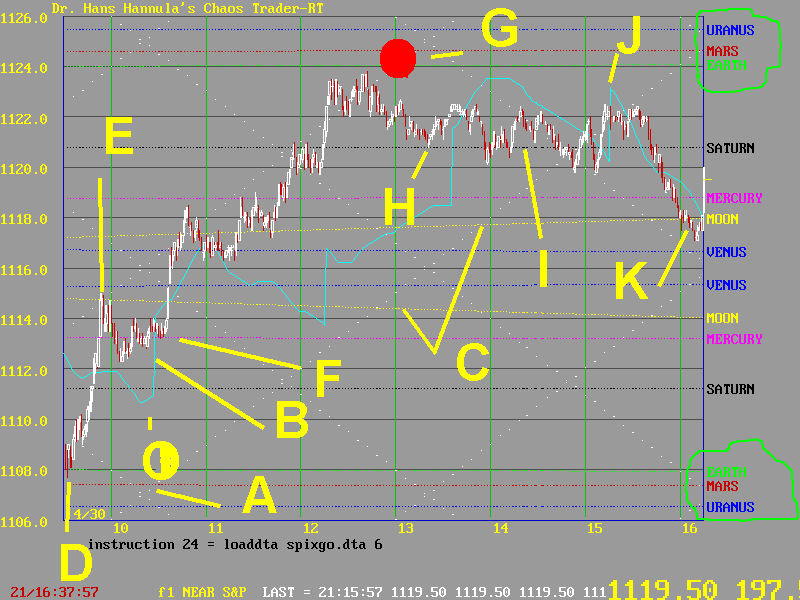


This chart shows how we CASHED IN ON THE MOON TIDES on April 30,1998.
Before the open, we know the Quarter Moon came early in the day. It is shown at A. We also had a + MoonTide as shown at B by the light blue line. What was unusual was that there were 4 vertical moves in the MoonTide. These often produce vertical price moves. We were also watching to see what Mars square Uranus would do, since it occurred overnight in perfect synchrony with the moon. We also know that the moon field flux lines shown in yellow at C would be strange attractors/repellors.
So we were not surprised when prices opened gap up at the cluster of Mars, Uranus, and Earth flux lines at D. Then prices ran right up to meet resistance at the moon line E. Then they pulled back some.
Our trade of the day, faxed out the night before, said to place a buy stop 1.5 points above price and a sell stop 1.5 points below price at 10:12 Eastern. Then when one stop is hit, trail the other 3 point from price. Finally, the instructions were to cover at 2:10 if still in. This "go with the flow" technique lets the market pick the direction. We use the MoonTide to pick the time. This one was picked just before the vertical rise in the +MoonTide. The goal was to catch what looked like a possible four hour move.
What we could not know in advance was that Mercury had temporarily captured prices at F. That gave plenty of time to get the stops in. Just after the Quarter moon at 10:36, we were elected long.
Prices rallied sharply until solar noon, at G. Note the Earth flux line in green is also a sun line. So the market rallied from MOON TIL NOON (solar noon). Notice what happened after that. The market went flat. Our trailing stop was hit at H, for a +6.6 points. That's over $1600 per contract.
After solar noon, prices rested on the black Saturn flux line at I. Late in the day they popped up at J, on the fourth vertical line in the MoonTide. Then they sagged into the close, until bouncing off the moon flux line at K.
Notice that the range of the day was set by the two clusters of Earth, Mars, Uranus lines.
There is always a lot to observe as the S&P moves. Each bar is driven by some ripple in the earth's electric field. Each ripple can be traced back to an electric field connected with one of the heavenly bodies. But it is impossible to watch them all and trade. So we focus on the MoonTide. It's very powerful, very real, and very profitable.